A look at Retina on AKS
Hello all!
As you may have noticed, the Kubernetes landscape is steadily evolving (again) with the adoption of eBPF. We talked about eBPF in other articles, mainly about Cilium CNI and its feature. However, since eBPF is this big, Isovalent people are definitly not the only one working on it. There’s a Microsoft OSS project named Retina that aims to provide Kubernetes Monitoring and that also leverage this technology. In this article, We’ll have a look at Retina in an AKS environment.
Our agenda will be as follow
- About Retina
- Preparing the lab
- What can we do with Retina
Let’s get started!
1. About Retina
As mentioned in the intro, Retina is an Open Source Software project, proposed by Microsoft and aiming to better the Network Observability in the Kubernetes landscape.
There is a dedicated web site for it, in addition to all the mention that are already available in the Azure documentation. As can be read on this site, tehre are 2 features in Retina.
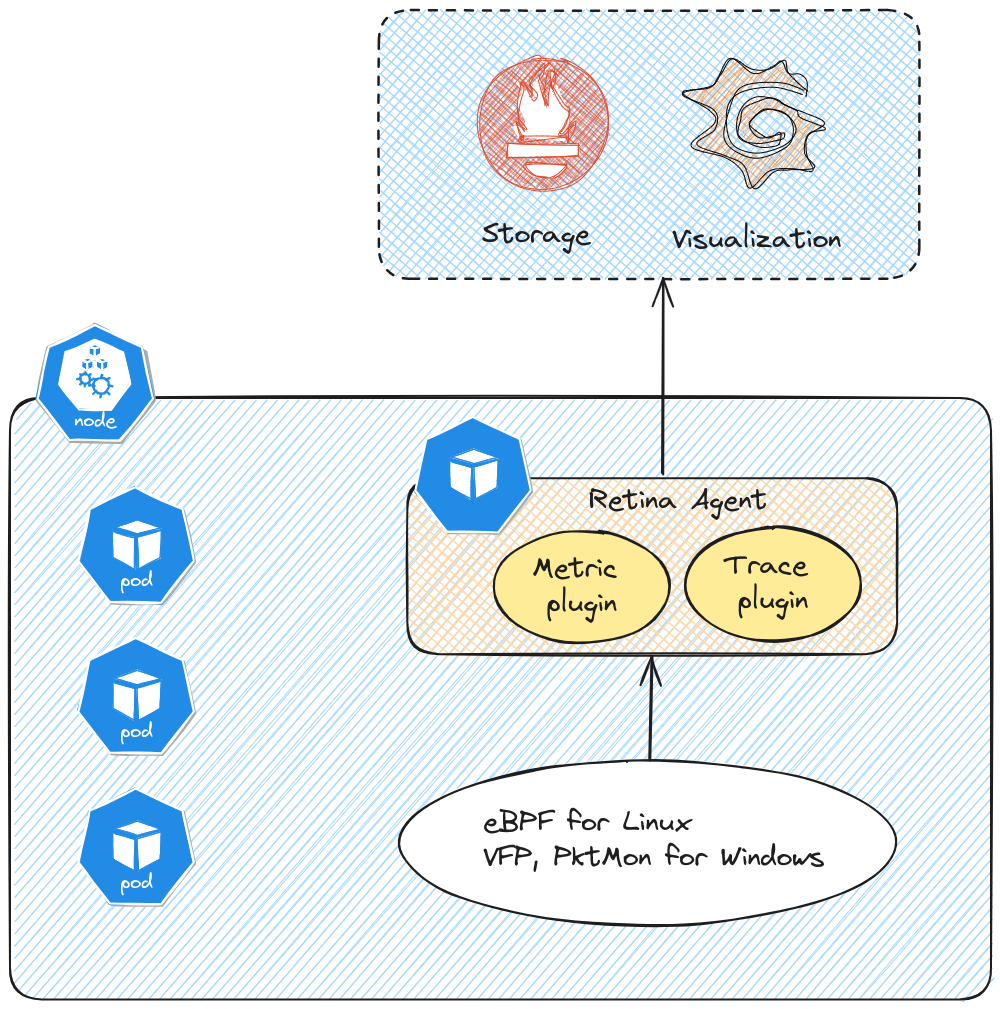
The first one is Metrics, which provide continuous observability on inbound & outbound traffic, dropped packets, API server latency, DNS, Node or interface statistics. About those metrics, we can leverage either the basic metrics, which limits itself to aggregated metrics by node, and advanced metrics which provides additional metrics related to source and destination pod. Those metrics are collected through eBPF for linux nodes. It’s interesting to note that Retina is also working for Windows nodes, and in this case, it relies on other technologies. Specifically for the metrics part, the mentionned technology is VFP, whic seems to refer to Virtual Filtering Platform. There is not that much documentation on this except a few publications.
The second feature is Capture. As the name implies, it gives a capability to capture network traffic for further analysis. As for Metrics, it uses eBPF and specifically inspektor gadget trace plugin for Linux nodes, and Pktmon, a Windows Server utility for Windows nodes. Capure can be used either with the retina cli, or through the use of CRD. The output can be hosted in the host file system, or a storage blob.
Now about the architecture, as coulb be expected, Retina relies on pods that have to be on all observed nodes. Thus, following this logic, we get a daemonset to ensure that each nodes get its retina agent. Because it’s not the same technology for Linux and Windows, we have 2 differents daemonsets, one each of the OS.
yumemaru@azure:~$ kubectl get daemonsets.apps -n kube-system
NAME                                           DESIRED   CURRENT   READY   UP-TO-DATE   AVAILABLE   NODE SELECTOR              AGE
===========================================TRUNCATED===========================================
retina-agent                                   3         3         3       3            3           kubernetes.io/os=linux     40h
retina-agent-win                               0         0         0       0            0           kubernetes.io/os=windows   40h
Let’s build a lab to test this.
2. Preparing the lab
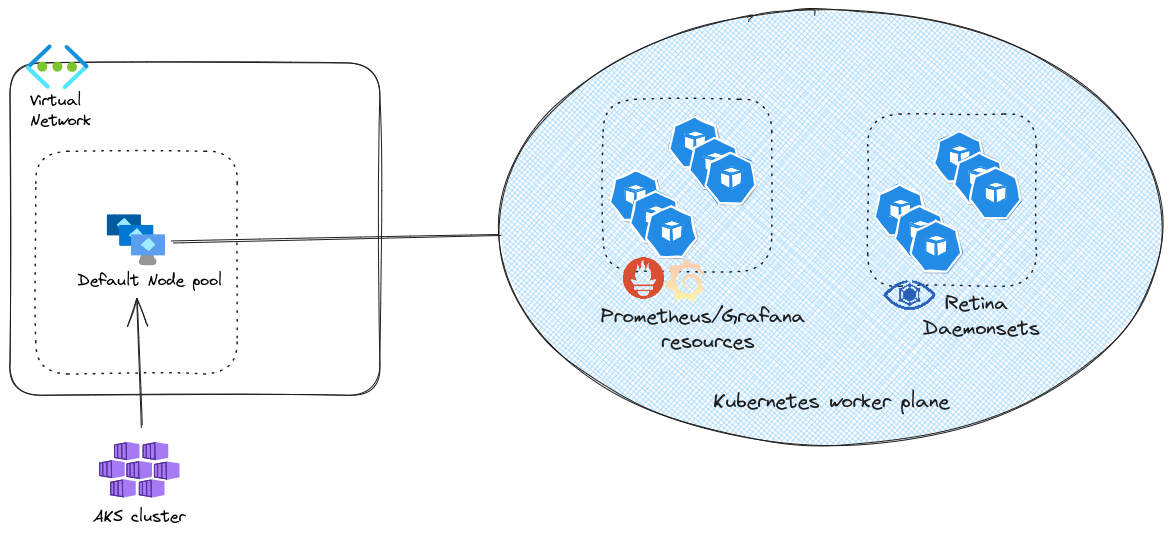
To test this monitoring solution, we’ll need the following
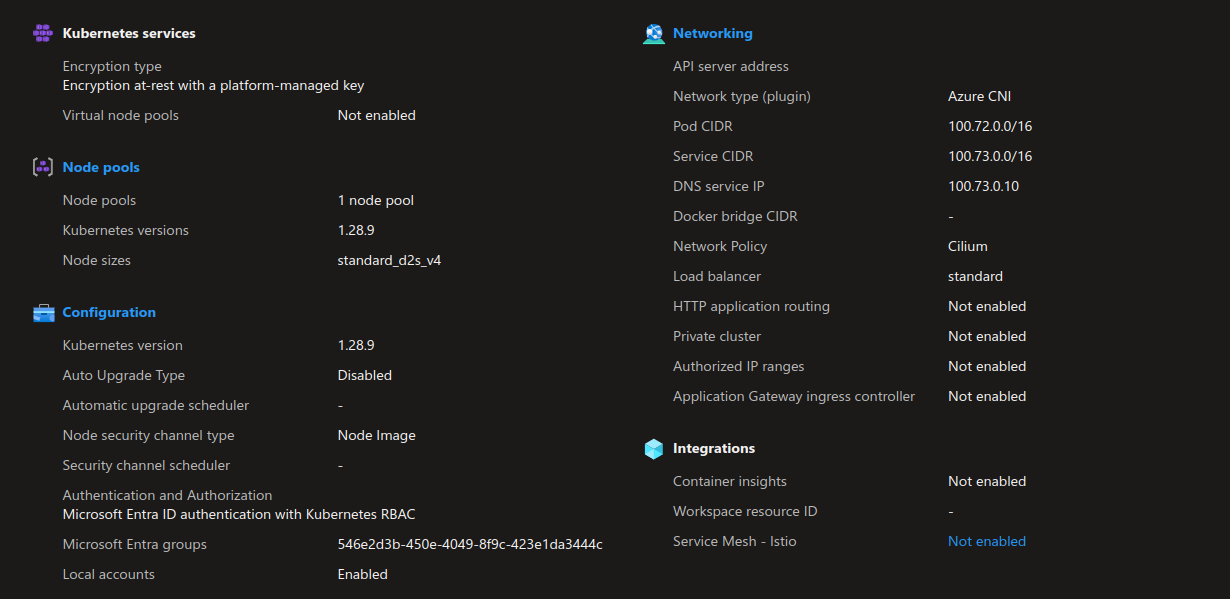
- An AKS cluster, that will be configured with Azure CNI with overlay, and Cilium dataplane
- A virtual Network in which the cluster will live
And in the cluster, we’ll deploy first a prometheus/grafan stack, then Retina.
For those interested, the lab config is available on github here.
There is nothing specific about the vnet or the AKS cluster. In this case, this is a cluster with Azure CNI powered by Cilium, in overlay mode. We’ll note that the instance type for thenode pool is D2s_v4. We’ll come back to this inthe next session.
To install the prometheus stack we rely on the kube-prometheus-stack from the helm repo https://prometheus-community.github.io/helm-charts.
Retina doc provides a yaml file for the configuration specific to the metric to collect:
windowsMonitoring:
  enabled: true

prometheusOperator:
  affinity:
    nodeAffinity:
      requiredDuringSchedulingIgnoredDuringExecution:
        nodeSelectorTerms:
          - matchExpressions:
              - key: kubernetes.io/os
                operator: In
                values:
                  - linux

  admissionWebhooks:
    deployment:
      affinity:
        nodeAffinity:
          requiredDuringSchedulingIgnoredDuringExecution:
            nodeSelectorTerms:
              - matchExpressions:
                  - key: kubernetes.io/os
                    operator: In
                    values:
                      - linux
    patch:
      affinity:
        nodeAffinity:
          requiredDuringSchedulingIgnoredDuringExecution:
            nodeSelectorTerms:
              - matchExpressions:
                  - key: kubernetes.io/os
                    operator: In
                    values:
                      - linux

prometheus:
  prometheusSpec:
    affinity:
      nodeAffinity:
        requiredDuringSchedulingIgnoredDuringExecution:
          nodeSelectorTerms:
            - matchExpressions:
                - key: kubernetes.io/os
                  operator: In
                  values:
                    - linux
    additionalScrapeConfigs: |
      - job_name: "retina-pods"
        kubernetes_sd_configs:
          - role: pod
        relabel_configs:
          - source_labels: [__meta_kubernetes_pod_container_name]
            action: keep
            regex: retina(.*)
          - source_labels:
              [__address__, __meta_kubernetes_pod_annotation_prometheus_io_port]
            separator: ":"
            regex: ([^:]+)(?::\d+)?
            target_label: __address__
            replacement: ${1}:${2}
            action: replace
          - source_labels: [__meta_kubernetes_pod_node_name]
            action: replace
            target_label: instance
        metric_relabel_configs:
          - source_labels: [__name__]
            action: keep
            regex: (.*)
After those initial steps, it’s time to install Retina. Taken from the documentation, we get the follogin helm cli command.
VERSION=$( curl -sL https://api.github.com/repos/microsoft/retina/releases/latest | jq -r .name)
helm upgrade --install retina oci://ghcr.io/microsoft/retina/charts/retina \
    --version $VERSION \
    --namespace kube-system \
    --set image.tag=$VERSION \
    --set operator.tag=$VERSION \
    --set image.pullPolicy=Always \
    --set logLevel=info \
    --set os.windows=true \
    --set operator.enabled=true \
    --set operator.enableRetinaEndpoint=true \
    --skip-crds \
    --set enabledPlugin_linux="\[dropreason\,packetforward\,linuxutil\,dns\,packetparser\]" \
    --set enablePodLevel=true \
    --set enableAnnotations=true
The deployment should be completed easily. However, checking that everything is all right afterward, you may discover something like that:
yumemaru@azure:~$ kubectl get daemonsets.apps -n kube-system
NAME                                           DESIRED   CURRENT   READY   UP-TO-DATE   AVAILABLE   NODE SELECTOR              AGE
===========================================TRUNCATED===========================================
retina-agent                                   3         3         2       3            3           kubernetes.io/os=linux     40h
retina-agent-win                               0         0         0       0            0           kubernetes.io/os=windows   40h
We’ll note, first that there is no pod in the daemonset for Windows nodes, but that’s because we don’t have any windows node 😱. Second, we can see that one of the pod for the linux agent is not ready. Loonking in details we can see something like below:
Events:
  Type     Reason            Age   From               Message
  ----     ------            ----  ----               -------
  Warning  FailedScheduling  108s  default-scheduler  0/3 nodes are available: 1 Insufficient cpu. preemption: 0/3 nodes are available: 3 No preemption victims found for incoming pod..
The message is clear, we don’t have enough resources remaining on the last node. If we look at the daemonset yaml config, we can find the following:
yumemaru@azure:~$ kubectl get ds -n kube-system retina-agent -o yaml
  resources:
    limits:
      cpu: 500m
      memory: 300Mi
    requests:
      cpu: 500m
      memory: 300Mi
Remember, we have a node pool configured to use the D2s_v4 size, which has only 2 CPU available. Granting request and limit of 500m to Retina is probably to much with those intances. Now, either we scale up the node pool instant size, or we can also choose to not deploy Retina on this default node pool, which is mainly for system workload. After all, do we care about the network traffic from the AKS-managed pod ?
Anyway, in this specific context, I do not wish to deploy additional node pools so I need to change some configuration to ensure that all my nodes get a Retina agent.
I’ll cheat a little (don’t do that in production obviously) and edit the daemonset to set the PriorityClassName to system-node-critical. This way we do ensure that the pod is scheduled on each nodes.
yumemaru@azure:~$ kubectl edit ds -n kube-system retina-agent
# Please edit the object below. Lines beginning with a '#' will be ignored,
# and an empty file will abort the edit. If an error occurs while saving this file will be
# reopened with the relevant failures.
#
apiVersion: apps/v1
kind: DaemonSet
metadata:
  annotations:
    deprecated.daemonset.template.generation: "5"
    meta.helm.sh/release-name: retina
    meta.helm.sh/release-namespace: kube-system
  creationTimestamp: "2024-06-24T13:52:39Z"
  generation: 5
  labels:
    app.kubernetes.io/component: workload
    app.kubernetes.io/instance: retina
    app.kubernetes.io/managed-by: Helm
    app.kubernetes.io/name: retina
    app.kubernetes.io/part-of: retina
    app.kubernetes.io/version: 0.0.1
    helm.sh/chart: retina-v0.0.12
    k8s-app: retina
  name: retina-agent
  namespace: kube-system
  ====================TRUNCATED====================
  template:
    metadata:
      annotations:
        checksum/config: a3c1c8676bf1ac68b21dbe42b5c3c10d0e177f1a322f419e27add9ee4c97eef9
        prometheus.io/port: "10093"
        prometheus.io/scrape: "true"
      creationTimestamp: null
      labels:
        app.kubernetes.io/component: workload
        app.kubernetes.io/instance: retina
        app.kubernetes.io/managed-by: Helm
        app.kubernetes.io/name: retina
        app.kubernetes.io/part-of: retina
        app.kubernetes.io/version: 0.0.1
        helm.sh/chart: retina-v0.0.12
        k8s-app: retina
    spec:
      priorityClassName: system-node-critical
      containers:
      ====================TRUNCATED====================
yumemaru@azure:~$ kubectl get ds -n kube-system retina-agent -o yaml | grep priorityClassName
      priorityClassName: system-node-critical
Once this configuration updated, we now have a retina agent on each node and we can check that prometheus can see the proper targets, as explained on the Retina doc.
yumemaru@azure:~$ kubectl port-forward -n kube-system services/prometheus-operated 9090
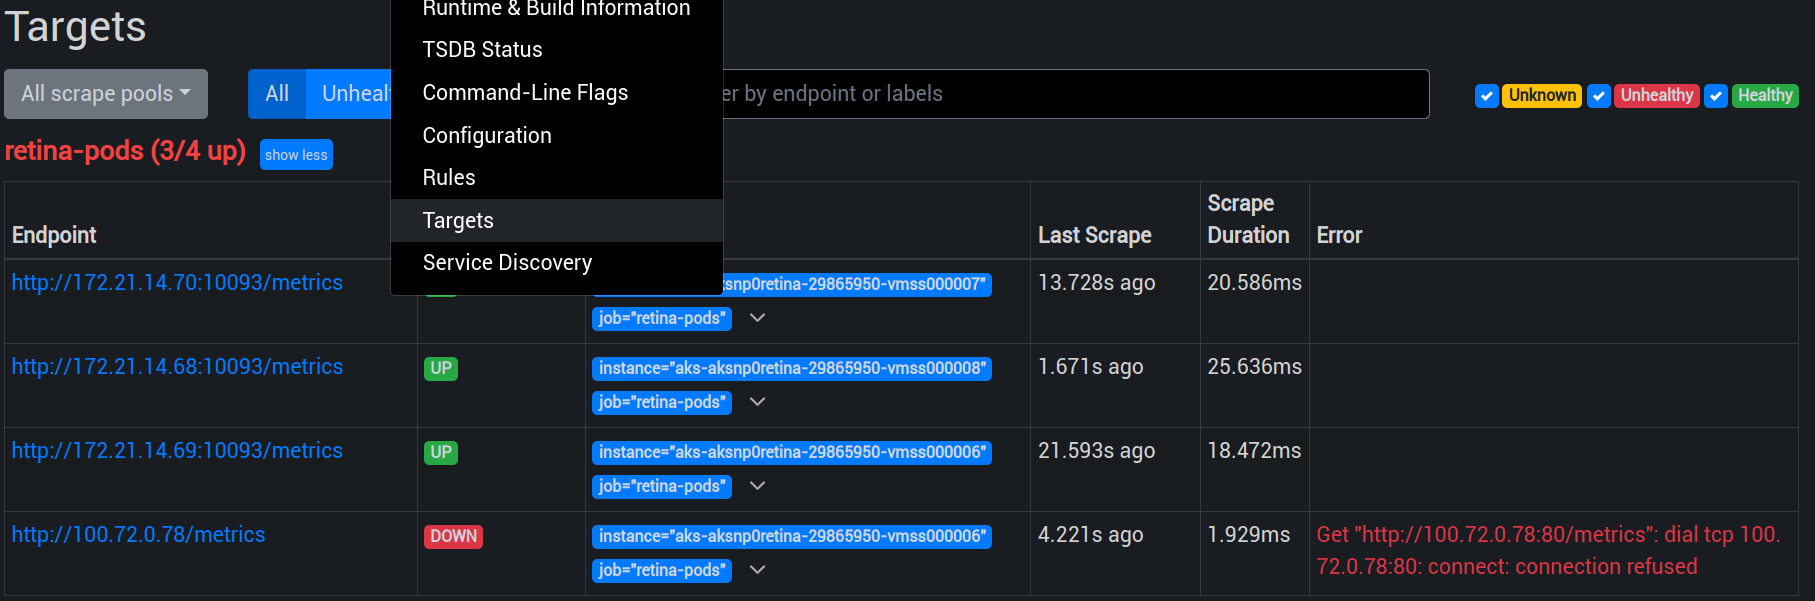
You may get an error related to the previous pod that did not start before the priorityClassName configuration. As long as the daemonset shows all replicas ready, we can ignore that.
Next is the addition of a dashboard in grafana. Again we can follow the documentation to find the dashboard here
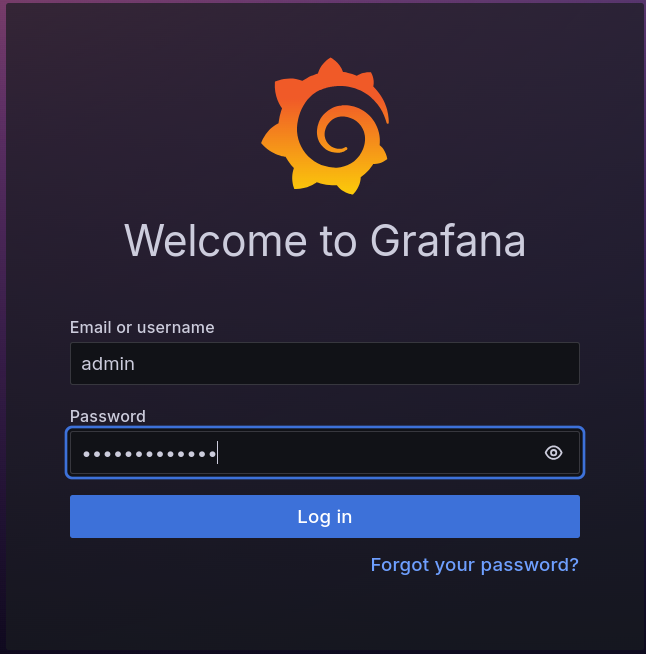
And connect to Grafana
yumemaru@azure:~$ kubectl get secret -n kube-system prometheus-stack-grafana -o jsonpath="{.data.admin-password}" | base64 --decode ; echo
prom-operator
yumemaru@azure:~$ kubectl get secret -n kube-system prometheus-stack-grafana -o jsonpath="{.data.admin-user}" | base64 --decode ; echo
admin
yumemaru@azure:~$ kubectl port-forward -n kube-system services/prometheus-stack-grafana :80
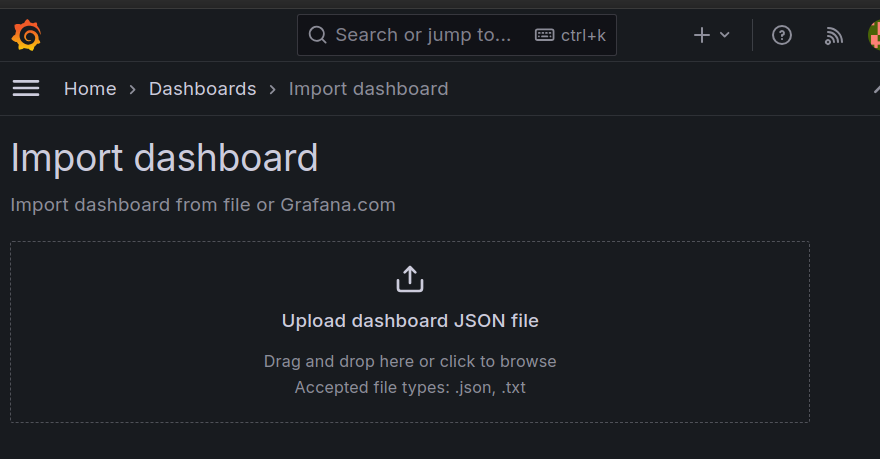
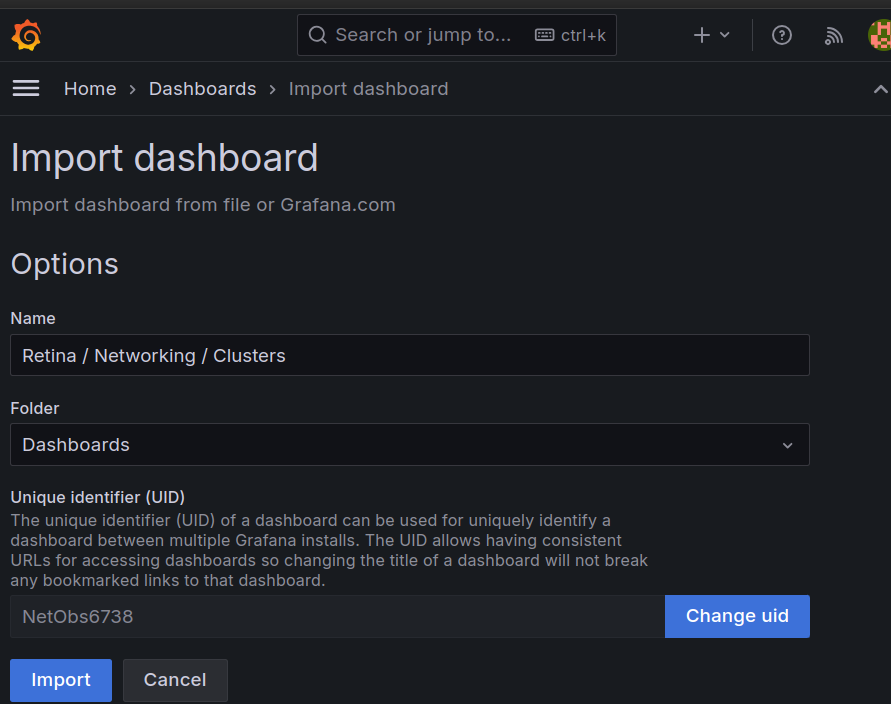
To import the dashboard
One last thing, there is a Retina cli available. This cli is installable through the krew command. We will need it in the next section so let’s install it.
yumemaru@azure:~$ kubectl krew install retina
yumemaru@azure:~$ kubectl retina version
v0.0.12
Ok, we have everything we need to look at what we can do with Retina now.
3. What can we do with Retina
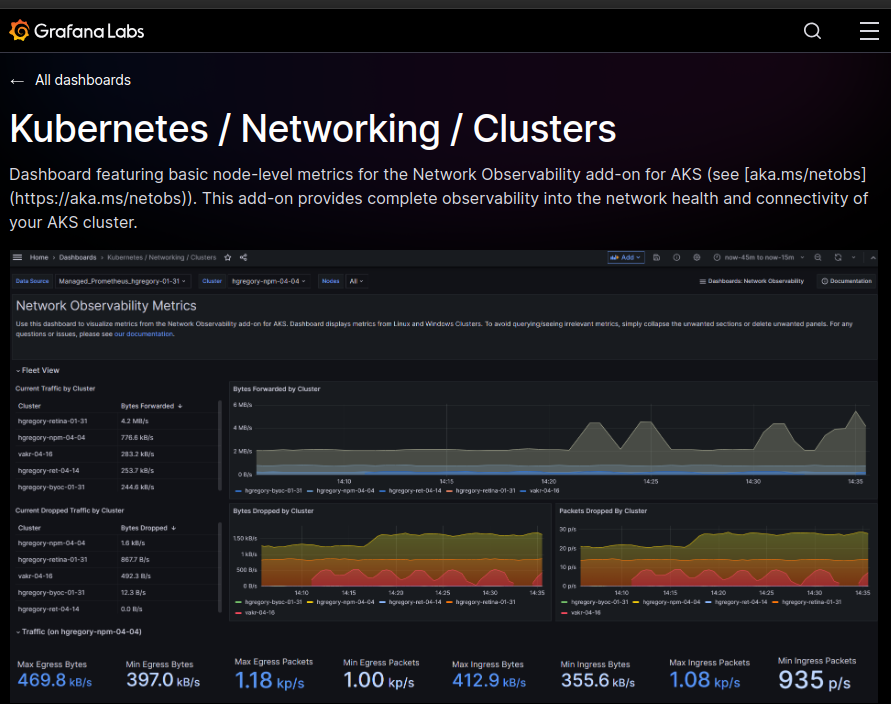
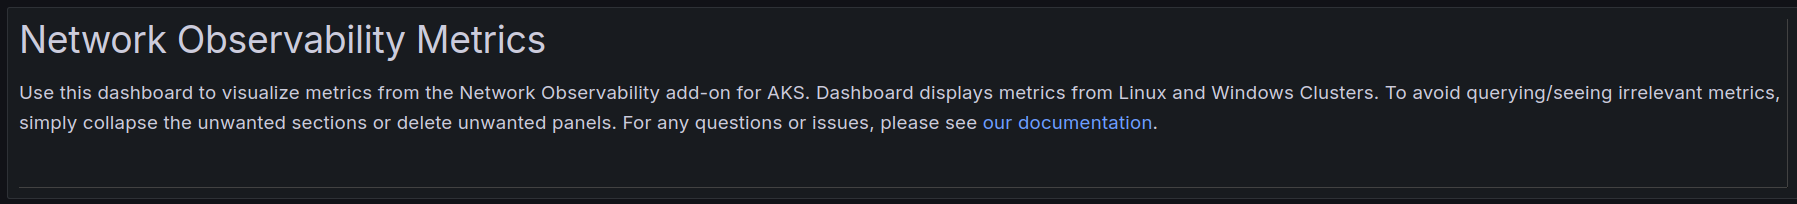
3.1. Grafana dashboard
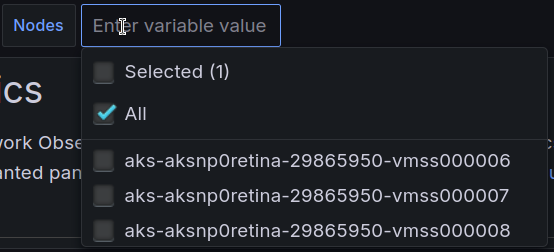
Following the previous part, we now have access to a dashboard focused on Network monitoring.
Browsing this dashboard, we can identify the nodes available
A reference to the azure documentation
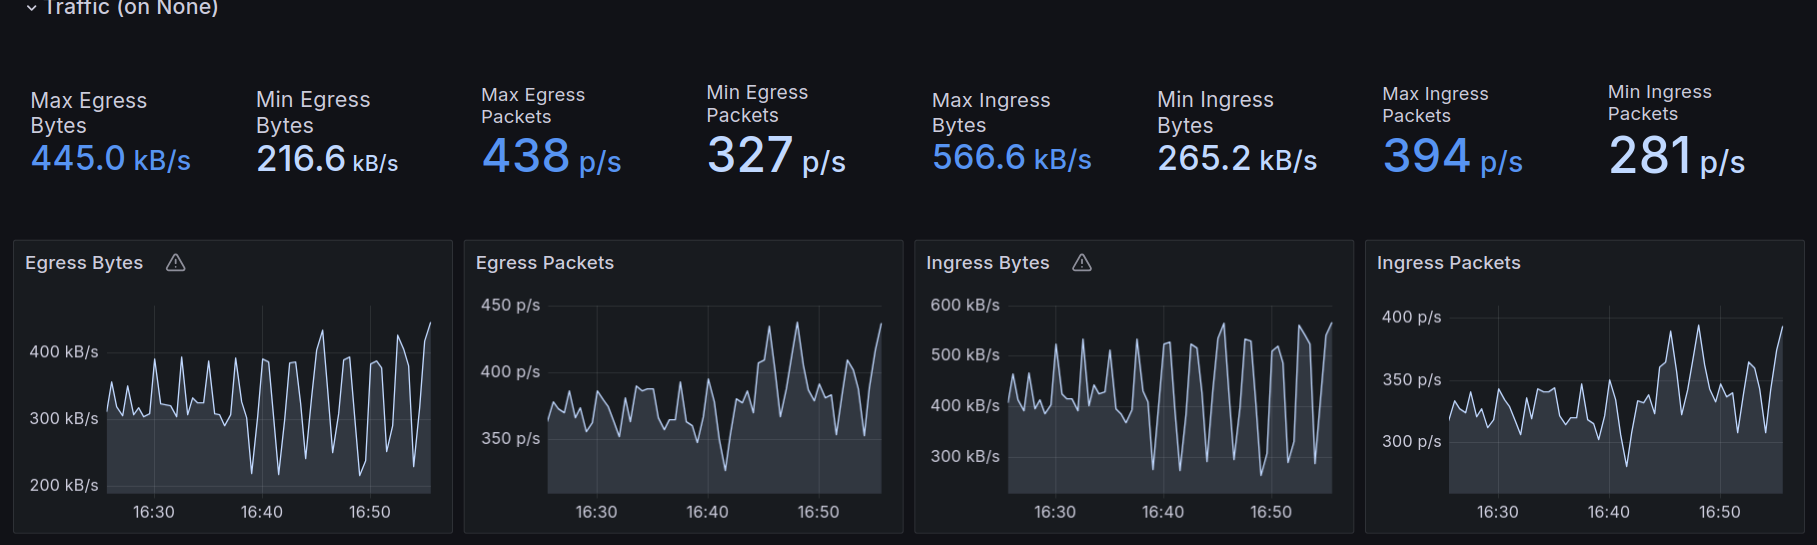
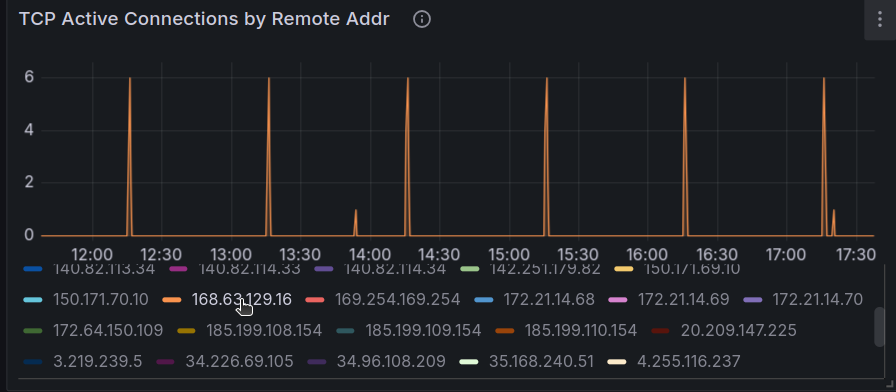
And metrics displayed in a visual way.
For example, we can see the remote IP addresses accessing the cluster
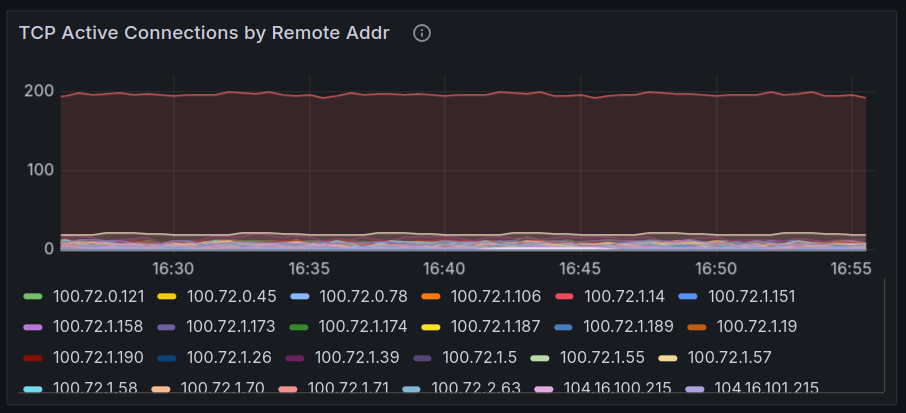
And specifically in this one the Azure DNS IP
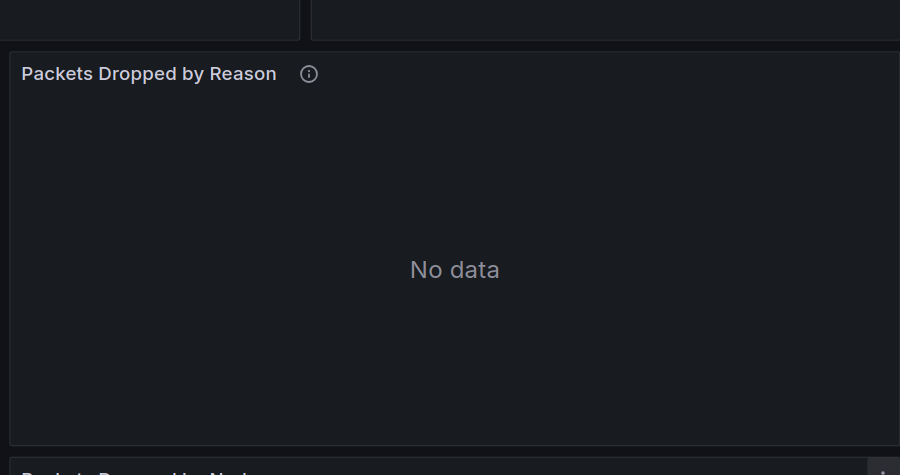
There is also metrics for dropped packet, but currently, it does not seem to report dropped packet because of network policies. That’s something to dig I guess.
3.2. Retina capture
The other interesting feature is the network capture. This is the typical network capture that sysadmin/network people are used to, and exploit with tools such as wireshark.
Using capture in retina is either done through the retina cli, that we install previously, or through a CRD. The cli is quite well documentated in the documentation. In our case, we are Azure people (aren’t we? 🤭) so we’ll configure the capture to be recorded on a storage account. We need to specify a Shared Access Signature, on the target blob container.
yumemaru@azure:~$ az storage account keys list --account-name <staname>
[
  {
    "creationTime": "2023-12-04T09:22:28.356128+00:00",
    "keyName": "key1",
    "permissions": "FULL",
    "value": "<access_key_value>"
  },
  {
    "creationTime": "2023-12-04T09:22:28.356128+00:00",
    "keyName": "key2",
    "permissions": "FULL",
    "value": "<access_key_value>"
  }
]
yumemaru@azure:~$  az storage container generate-sas --account-key <access_key_value> --account-name <sta_name> --name <container_name> --permissions dlrw --expiry <expiry_date>
"<sas_value>"
yumemaru@azure:~$ export retinaendpoint="https://<staname>.blob.core.windows.net/<container_name>?se=<expiry_date>&<sas_value>"
once we got this, we can launch the capture through the cli. It will generate a kubernetes job and collect the data in the specified blob storage.
yumemaru@azure:~$ k retina capture create --name capture --blob-upload $retinaendpoint --namespace-selectors "  " --pod-selectors "org=retina" --duration=2m
ts=2024-06-27T15:17:13.452+0200 level=info caller=capture/create.go:243 msg="The capture duration is set to 2m0s"
ts=2024-06-27T15:17:13.452+0200 level=info caller=capture/create.go:289 msg="The capture file max size is set to 100MB"
ts=2024-06-27T15:17:13.904+0200 level=info caller=utils/capture_image.go:56 msg="Using capture workload image ghcr.io/microsoft/retina/retina-agent:v0.0.12 with version determined by CLI version"
ts=2024-06-27T15:17:13.906+0200 level=info caller=capture/crd_to_job.go:224 msg="BlobUpload is not empty"
ts=2024-06-27T15:17:14.576+0200 level=info caller=capture/crd_to_job.go:876 msg="The Parsed tcpdump filter is \"\""
ts=2024-06-27T15:17:14.692+0200 level=info caller=capture/create.go:369 msg="Packet capture job is created" namespace=default capture job=capture-tzpcz
ts=2024-06-27T15:17:14.692+0200 level=info caller=capture/create.go:125 msg="Please manually delete all capture jobs"
ts=2024-06-27T15:17:14.692+0200 level=info caller=capture/create.go:127 msg="Please manually delete capture secret" namespace=default secret name=capture-blob-upload-secretmjj9j
NAMESPACE   CAPTURE NAME   JOBS            COMPLETIONS   AGE
default     capture        capture-tzpcz   0/1           0s
The main power of the capture tool in this case is the capability to scope per node, namespace, or even pod
Flags:
      --blob-upload string            Blob SAS URL with write permission to upload capture files
      --debug                         When debug is true, a customized retina-agent image, determined by the environment variable RETINA_AGENT_IMAGE, is set
      --duration duration             Duration of capturing packets (default 1m0s)
      --exclude-filter string         A comma-separated list of IP:Port pairs that are excluded from capturing network packets. Supported formats are IP:Port, IP, Port, *:Port, IP:*
  -h, --help                          help for create
      --host-path string              HostPath of the node to store the capture files
      --include-filter string         A comma-separated list of IP:Port pairs that are used to filter capture network packets. Supported formats are IP:Port, IP, Port, *:Port, IP:*
      --include-metadata              If true, collect static network metadata into capture file (default true)
      --job-num-limit int             The maximum number of jobs can be created for each capture. 0 means no limit
      --max-size int                  Limit the capture file to MB in size which works only for Linux (default 100)
      --namespace-selectors string    A comma-separated list of namespace labels in which to apply the pod-selectors. By default, the pod namespace is specified by the flag namespace
      --no-wait                       Do not wait for the long-running capture job to finish (default true)
      --node-names string             A comma-separated list of node names to select nodes on which the network capture will be performed
      --node-selectors string         A comma-separated list of node labels to select nodes on which the network capture will be performed
      --packet-size int               Limits the each packet to bytes in size which works only for Linux
      --pod-selectors string          A comma-separated list of pod labels to select pods on which the network capture will be performed
      --pvc string                    PersistentVolumeClaim under the specified or default namespace to store capture files
      --s3-access-key-id string       S3 access key id to upload capture files
      --s3-bucket string              Bucket in which to store capture files
      --s3-endpoint string            Endpoint for an S3 compatible storage service. Use this if you are using a custom or private S3 service that requires a specific endpoint
      --s3-path string                Prefix path within the S3 bucket where captures will be stored (default "retina/captures")
      --s3-region string              Region where the S3 compatible bucket is located
      --s3-secret-access-key string   S3 access secret key to upload capture files
      --tcpdump-filter string         Raw tcpdump flags which works only for Linux

Global Flags:
      --as string                      Username to impersonate for the operation. User could be a regular user or a service account in a namespace.
      --as-group stringArray           Group to impersonate for the operation, this flag can be repeated to specify multiple groups.
      --as-uid string                  UID to impersonate for the operation.
      --cache-dir string               Default cache directory (default "/home/df/.kube/cache")
      --certificate-authority string   Path to a cert file for the certificate authority
      --client-certificate string      Path to a client certificate file for TLS
      --client-key string              Path to a client key file for TLS
      --cluster string                 The name of the kubeconfig cluster to use
      --context string                 The name of the kubeconfig context to use
      --disable-compression            If true, opt-out of response compression for all requests to the server
      --insecure-skip-tls-verify       If true, the server's certificate will not be checked for validity. This will make your HTTPS connections insecure
      --kubeconfig string              Path to the kubeconfig file to use for CLI requests.
      --name string                    The name of the Retina Capture
  -n, --namespace string               If present, the namespace scope for this CLI request
      --request-timeout string         The length of time to wait before giving up on a single server request. Non-zero values should contain a corresponding time unit (e.g. 1s, 2m, 3h). A value of zero means don't timeout requests. (default "0")
  -s, --server string                  The address and port of the Kubernetes API server
      --tls-server-name string         Server name to use for server certificate validation. If it is not provided, the hostname used to contact the server is used
      --token string                   Bearer token for authentication to the API server
      --user string                    The name of the kubeconfig user to use
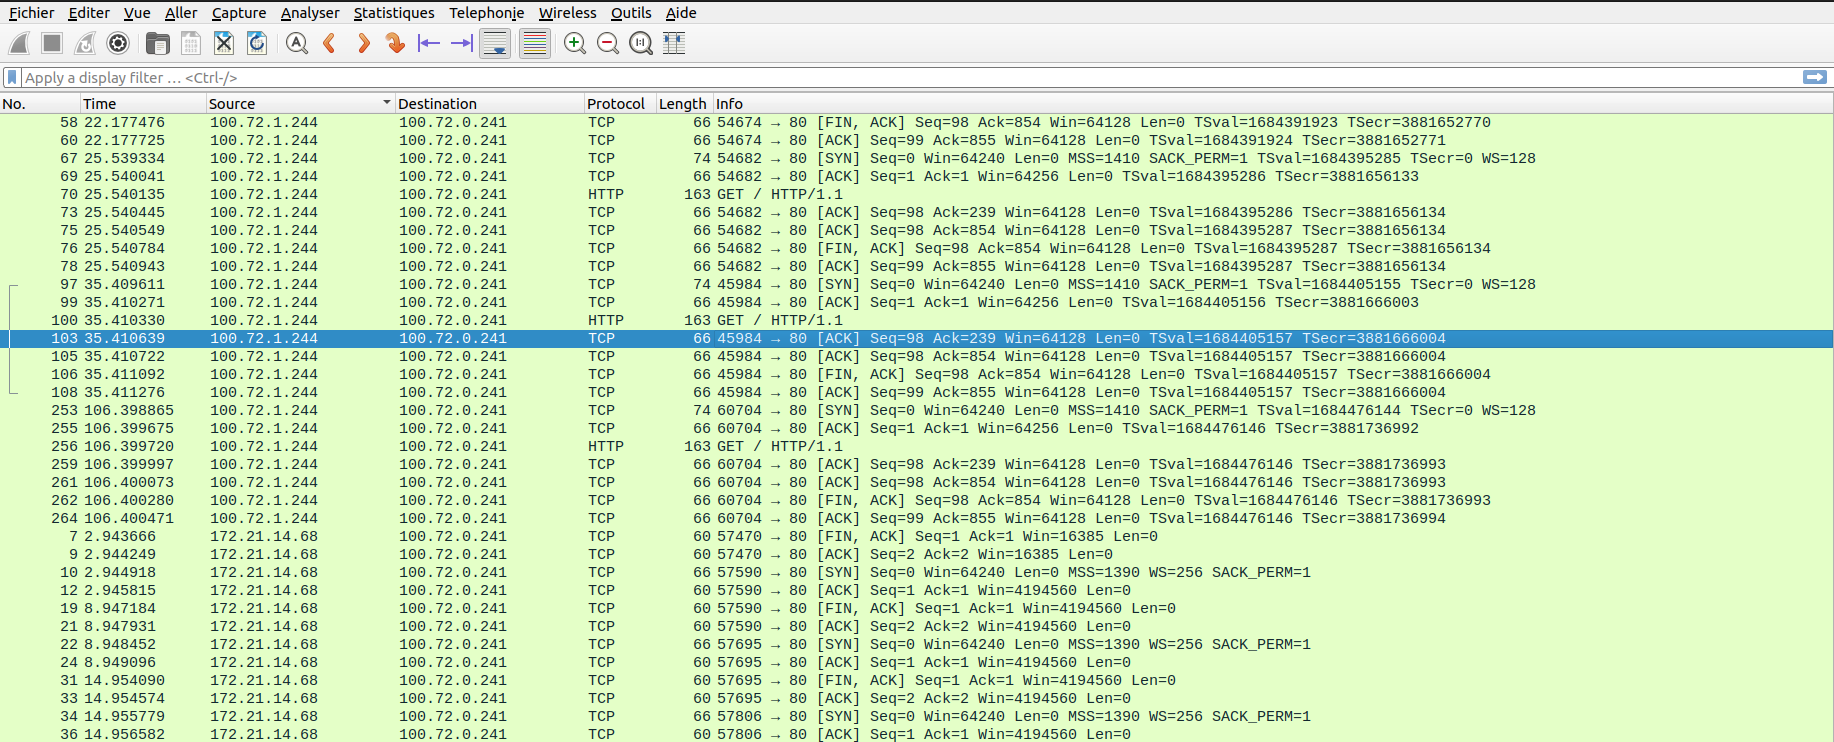
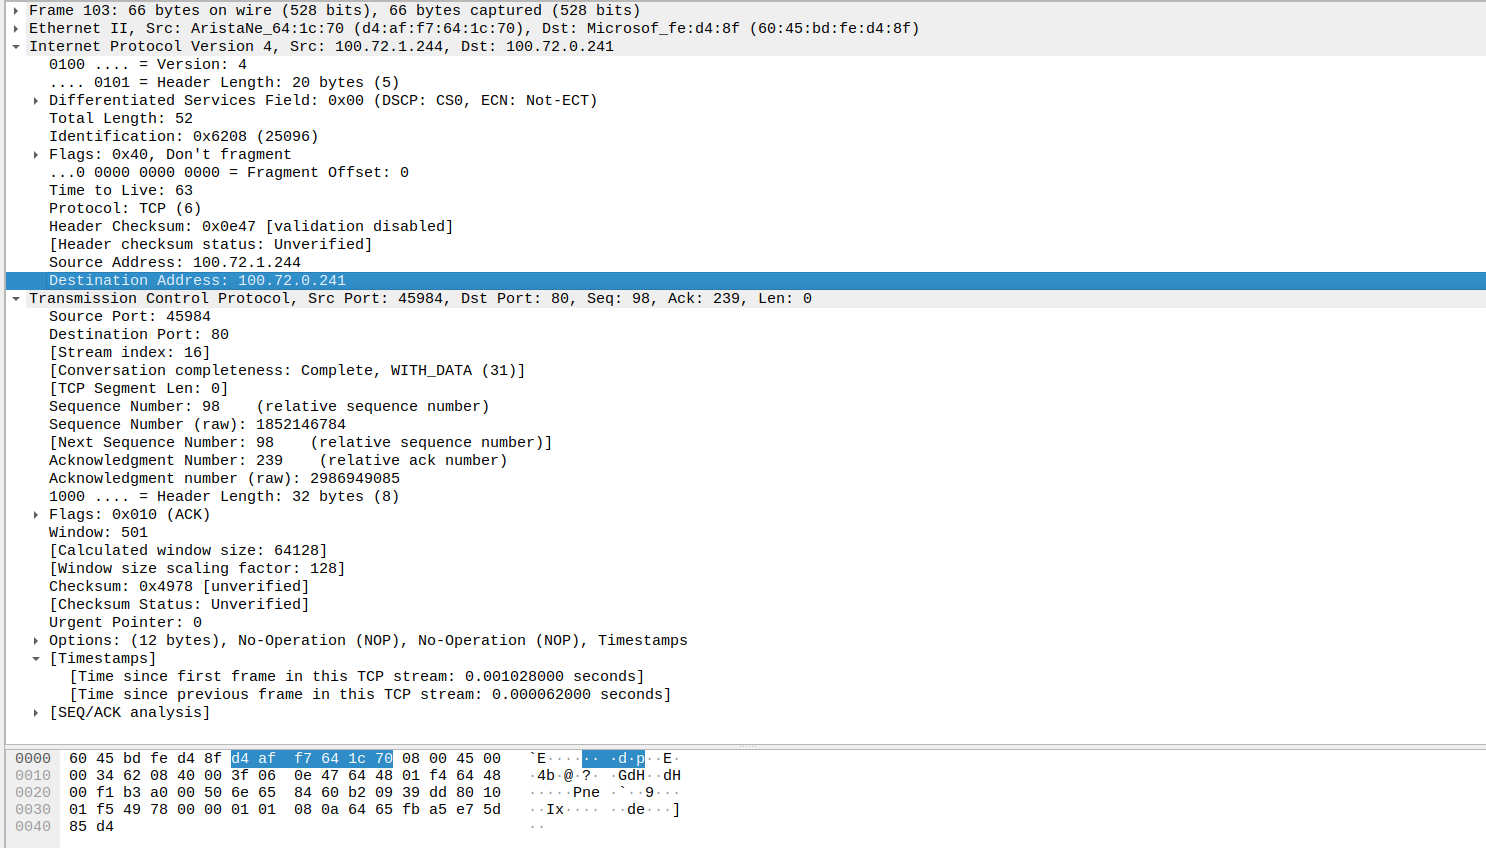
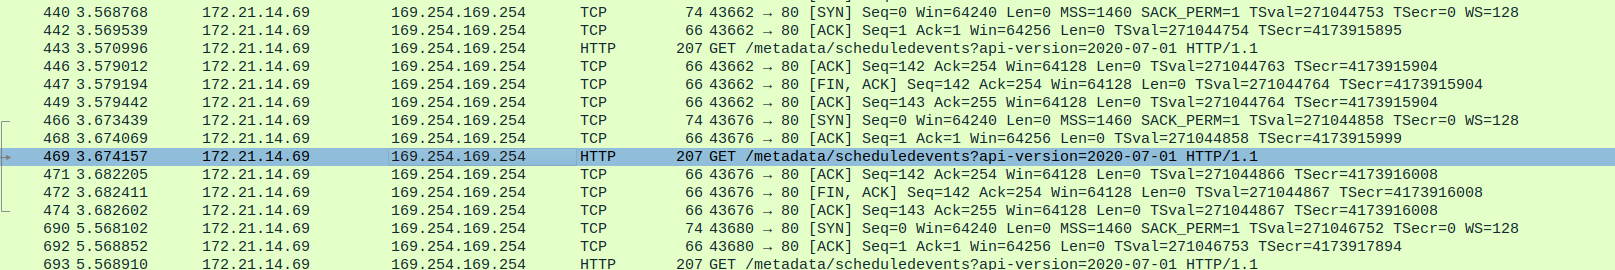
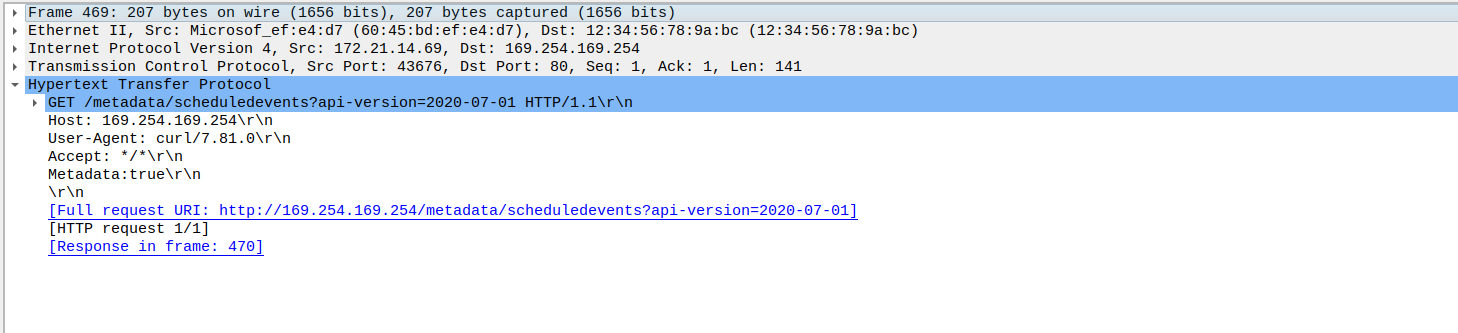
After the capture, we get a tag.gz file which contains a .pcap file. This file is readable with whireshark. In this sample we can see some o fthe traffic that I generated during the capture
yumemaru@azure:~$ k get pod nginxclient-5c5b9b57b8-4kdml -o wide
NAME                           READY   STATUS    RESTARTS   AGE     IP             NODE                                   NOMINATED NODE   READINESS GATES
nginxclient-5c5b9b57b8-4kdml   1/1     Running   0          7h29m   100.72.1.244   aks-aksnp0retina-29865950-vmss00000a   <none>           <none>

yumemaru@azure:~$ k get pod -n demo -o wide
NAME                         READY   STATUS    RESTARTS   AGE     IP             NODE                                   NOMINATED NODE   READINESS GATES
demodeploy-f67b46b7b-8zmtb   1/1     Running   0          7h30m   100.72.0.241   aks-aksnp0retina-29865950-vmss000009   <none>           <none>


yumemaru@azure:~$ k exec deployments/nginxclient -- curl -i -X GET http://demodeploy.demo.svc.cluster.local
  % Total    % Received % Xferd  Average Speed   Time    Time     Time  Current
                                 Dload  Upload   Total   Spent    Left  Speed
100   615  100   615    0     0  58992      0 --:--:-- --:--:-- --:--:-- 61500
HTTP/1.1 200 OK
Server: nginx/1.27.0
Date: Thu, 27 Jun 2024 13:17:53 GMT
Content-Type: text/html
Content-Length: 615
Last-Modified: Tue, 28 May 2024 13:22:30 GMT
Connection: keep-alive
ETag: "6655da96-267"
Accept-Ranges: bytes

<!DOCTYPE html>
<html>
<head>
<title>Welcome to nginx!</title>
<style>
html { color-scheme: light dark; }
body { width: 35em; margin: 0 auto;
font-family: Tahoma, Verdana, Arial, sans-serif; }
</style>
</head>
<body>
<h1>Welcome to nginx!</h1>
<p>If you see this page, the nginx web server is successfully installed and
working. Further configuration is required.</p>

<p>For online documentation and support please refer to
<a href="http://nginx.org/">nginx.org</a>.<br/>
Commercial support is available at
<a href="http://nginx.com/">nginx.com</a>.</p>

<p><em>Thank you for using nginx.</em></p>
</body>
</html>
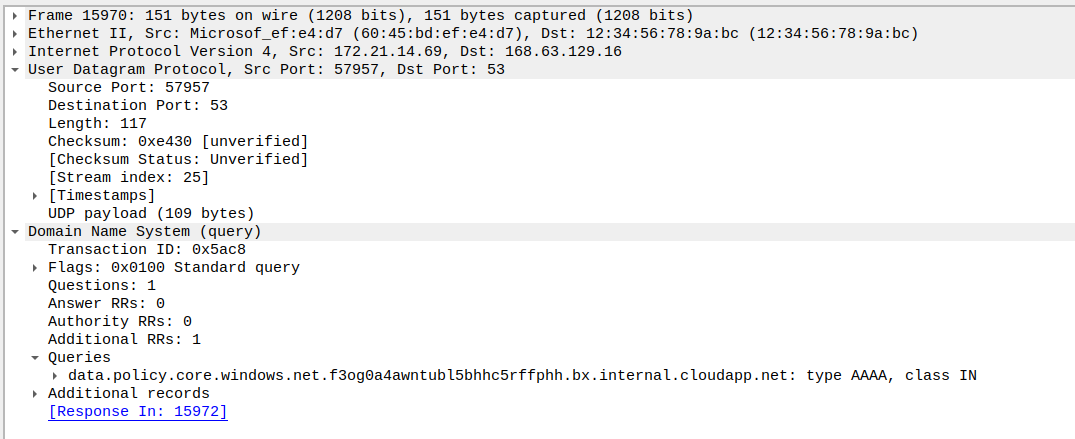
If we used the capture on the node selector level, we could see traffic related to Azure DNS or to the Instance MetadataService

We’ll note however that we can get this kind of information from the Network Watcher capture also. The specificity of Retina capture is more related to its availability in When comparing both capture tool, the main advantages of Retina over NEtwork Watcher are the kubernetes level filtering on one part, and the scope of execution, which does not require access on the Network level, which is probzbly not the case for a platform engineering team responsible for kubernetes clusters.
Beforce concluding this article, we should have a look at the Retina capture through CRD.
That can be done only if the installation included support for the capture. The CRD specification is available on the retina documentation, as expected:
- API Group: retina.sh
- API Version: v1alpha1
- Kind: Capture
- Plural: captures
- Singular: capture
- Scope: Namespaced
To create a capture with a CRD, we use the following manifest.
apiVersion: retina.sh/v1alpha1
kind: Capture
metadata:
  name: samplecrdcapture
spec:
  captureConfiguration:
    captureOption:
      duration: "120s"
    captureTarget:
      namespaceSelector:
        matchLabels:
          kubernetes.io/metadata.name: demo
      podSelector:
        matchLabels:
          org: retina
  outputConfiguration:
    blobUpload: blob-sas-url
With a corresponding secret for the blob url.
apiVersion: v1
data:
  blob-sas-url: <base64encodedsecret>
kind: Secret
metadata:
  name: blob-sas-url
We can see the pod corresponding to the job:
yumemaru@azure:~$ k get pod
NAME                           READY   STATUS      RESTARTS   AGE
nginxclient-5c5b9b57b8-94s7r   1/1     Running     0          2d5h
nginxclient-5c5b9b57b8-9jkxx   1/1     Running     0          2d5h
nginxclient-5c5b9b57b8-sg89l   1/1     Running     0          2d5h
samplecrdcapture-lsjdz-gzqk9   0/1     Completed   0          2m21s

yumemaru@azure:~$ k get jobs.batch
NAME                     COMPLETIONS   DURATION   AGE
samplecrdcapture-lsjdz   1/1           2m4s       5m18s
Ok, time to wrap up!
4. Summary
So we have this nice network monitoring tool available for free, ad that leverage eBPF. Coupled with an installation of prometheus, we can get a nice visiblity of the network aht is otherwise not easily available. We can also create network capture for post-analysis. This capture, avaible through cli or CRD, is comparable to a Network Watcher capture but with an access scoped on the kubernetes plane level, which definitely make sense for kubernetes native teams. Some additional samples are available on the retina github. And last but not least, Retina is included in the Microsoft managed offer Advanced Network Observability, which itself a part of the Advanced container networking services suite. We’ll stop for now but there is probably some digging to be done on all of those stuff ^^