What if I want to see Network Logs on Azure? - Part1
Hello everyone!
in this article, I propose a journey in the Azure Network observability. After choosing what to do in terms of Azure Network topology, at one point, we have to consider operations, which means we need to see which flows go through which firewalls. As most people using Azure probably know, those firewalls can take different forms and the associated visibility will depends of the firewall nature. So, we will start by a rapid review of the possiblility for the Network filtering in Azure and we will have a look at the different logs (because visibility is almost always related to logs) available for the Azure Network services through different scenarios.
Let’s get started!
1. Review of Azure Network filtering options
Depending on the objective, we may use differents solutions for Network filtering in Azure:
- locally to a virtual network, we usually rely on Network Security Groups. If you’re familiar with this service, you probably know that it’s perfect to secure flows between workload inside Azure subnet in a granular way, as long as the requirement is on the layer 4.
- In a Hub & Spoke scenario, with virtual Network or Virtual WAN and Virtual Hub, we rely on a central Firewall that can be used to filter interspoke traffic, egress traffic to Internet, and in some scenario (but with additional services) Internet exposure. This Hub Firewall can be an Azure Firewall, or a 3rd party appliance. However, We’ll focus on Azure Firewall here, because we are interested in Azure Native observability options
I mentionned additional services for Internet exposure, including WAF related solutions, but we will focus mainly on NSGs and Azure Firewall. IMHO, WAF is a full topic on its own so I’d prefer addressing that in a dedicated article.
Last, we also have some Security control available with Azure Network Manager, but, as for WAF, I think it deserves its own article ^^.
Ok let’s get to the heart of the topic.
2. Getting visibility for flows going through NSGs - Basics
NSGs are L4 statefull Firewall, as we said already, perfect for VNet local filtering. We can use Network watcher to evaluate the flows but it does not show information on real packet going through the NSG. For that we need to rely on logs, which are NOT configured by default.
As for most of Aure managed services, we have Azure Resources Logs available for NSG, that we can set in the Diagnostic Settings section of the resource
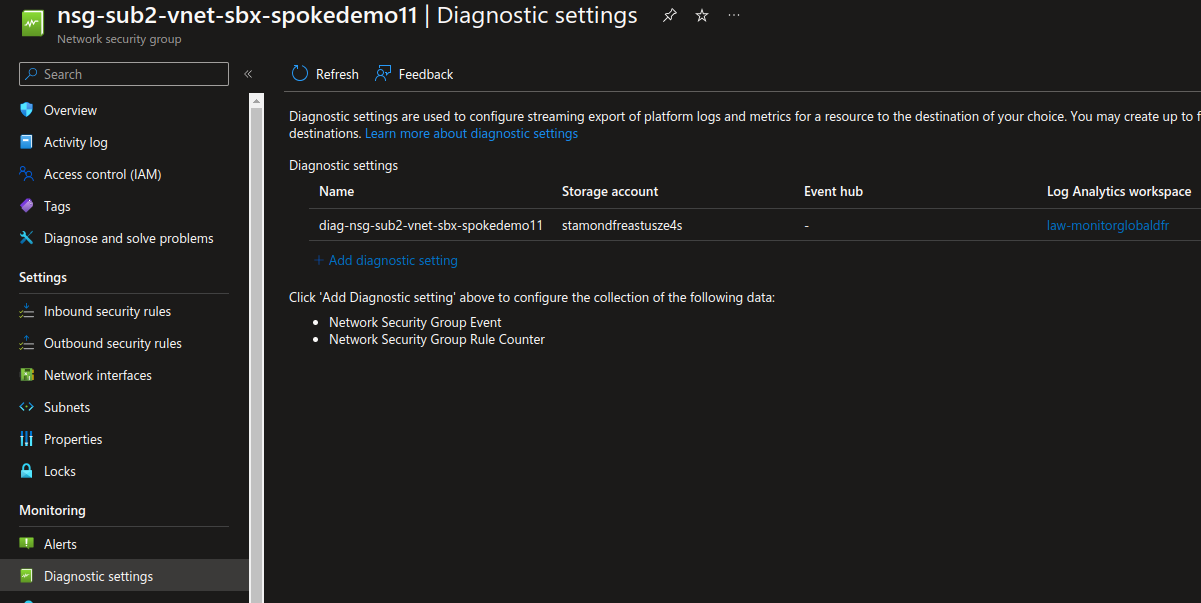
As displayed on the picture, there are 2 available categories:
Network Security Group EventNetwork Security Group Rule Counter
To be able to look at those logs, we need to send the logs in a sink that allows querying. There are many options, but the native one (and unfortunately quite expensive also) is to use a log analytics workspace. It quite easy to do it from the portal, and doing it through terraform would look like this:
resource "azurerm_monitor_diagnostic_setting" "NsgDiagSettings" {
  for_each                   = local.Subnets
  name                       = local.Subnets[each.key].Nsg.DiagSettingsName #format("%s-%s", "diag", azurerm_network_security_group.Nsgs[each.key].name)
  storage_account_id         = local.StaLogId
  log_analytics_workspace_id = local.LawLogId
  target_resource_id         = azurerm_network_security_group.Nsgs[each.key].id

  dynamic "enabled_log" {
    for_each = data.azurerm_monitor_diagnostic_categories.Nsg[each.key].log_category_types
    content {
      category = enabled_log.value

    }
  }

  dynamic "metric" {
    for_each = data.azurerm_monitor_diagnostic_categories.Nsg[each.key].metrics
    content {
      category = metric.value

    }
  }
}
Notice the reference to the data source for the log categories, which is instrumented this way, and allows us to automatically get all the log categories. On the other hand, it implies a re-evaluation at each plan / apply.
data "azurerm_monitor_diagnostic_categories" "Nsg" {

  for_each    = local.Subnets
  resource_id = azurerm_network_security_group.Nsgs[each.key].id
}
There is also an Azure policy available for configuring NSG that would not have a diagnostic settings. Details on this policy can be found on the fantastic azadvertizer.net corresponding page.
Now looking at the logs, the category Network Security Group Rule Counter gives mostly basic informations on network flows, while Network Security Group Rule Counter
Let’s have a look. As we’ve seen earlier, logs are available from a log analytocs workspace, so we need to have access to one. However, because the diagnostic settings are resources associated directly to the resources, it is possible the query logs from either the workspace , or directly from the resource:
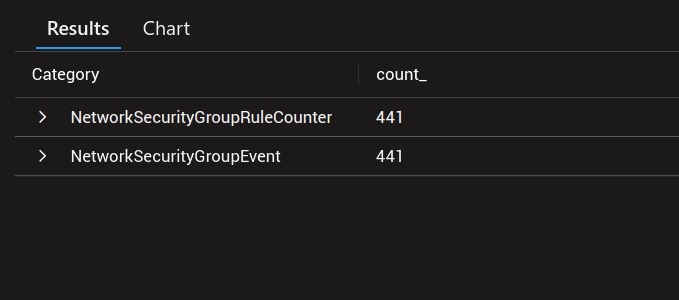
On the log analytics workspace, the following request, executed from the resource, will allows us to see all NSG related event.
AzureDiagnostics
| where TimeGenerated >= ago(24h)
| summarize count() by Category
However, if we run this request directly from the workspace, we need to specify the scope if we want to see only NSG related logs. In this case the query becomes this:
AzureDiagnostics
| where TimeGenerated >= ago(24h)
| where ResourceId == "/SUBSCRIPTIONS/00000000-0000-0000-0000-000000000000/RESOURCEGROUPS/<rGName>/PROVIDERS/MICROSOFT.NETWORK/NETWORKSECURITYGROUPS/<nsgName>"
| summarize count() by Category
Note: The query may not return any result if the resource id is not written in full capital, e.g /SUBSCRIPTIONS/00000000-0000-0000-0000-000000000000/RESOURCEGROUPS/<rGName>/PROVIDERS/MICROSOFT.NETWORK/NETWORKSECURITYGROUPS/<nsgName>
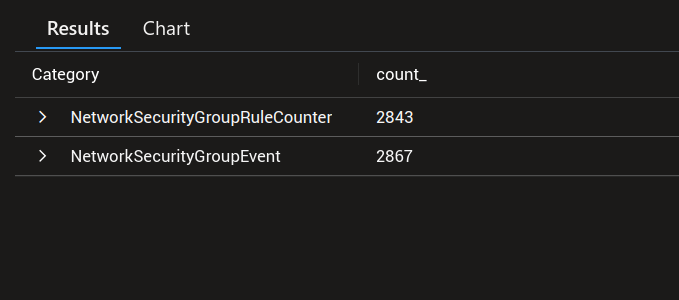
If we want to only limit ourselves to the NSGs, in general, we can use this query:
AzureDiagnostics
| where TimeGenerated >= ago(24h)
| where ResourceId contains "/PROVIDERS/MICROSOFT.NETWORK/NETWORKSECURITYGROUPS/"
| summarize count() by Category
3. Statistics on rules involved in flows
With the category Network Security Group Rule Counter, we can get basic informations such as the rules involved in network flows:
AzureDiagnostics
| where TimeGenerated >= ago(24h)
| where Category == "NetworkSecurityGroupRuleCounter"
| where ResourceId == "/SUBSCRIPTIONS/00000000-0000-0000-0000-000000000000/RESOURCEGROUPS/<rGName>/PROVIDERS/MICROSOFT.NETWORK/NETWORKSECURITYGROUPS/<nsgName>"
| project TimeGenerated,ruleName_s,type_s,direction_s,SourceSystem,primaryIPv4Address_s
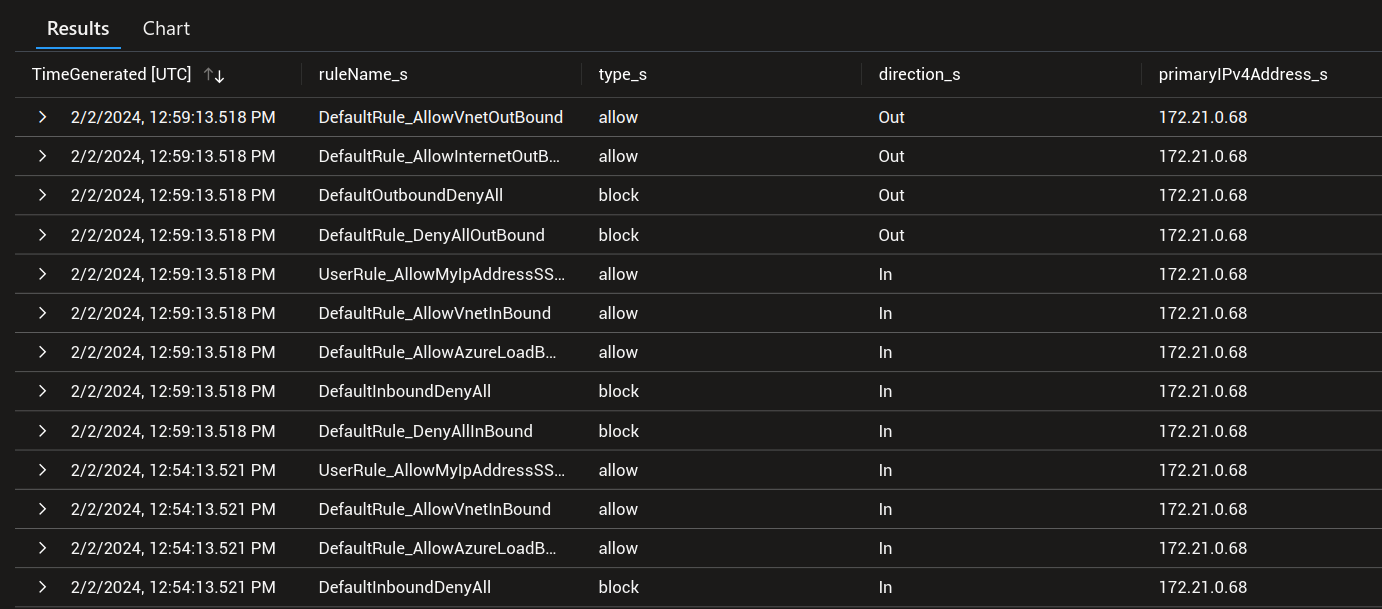
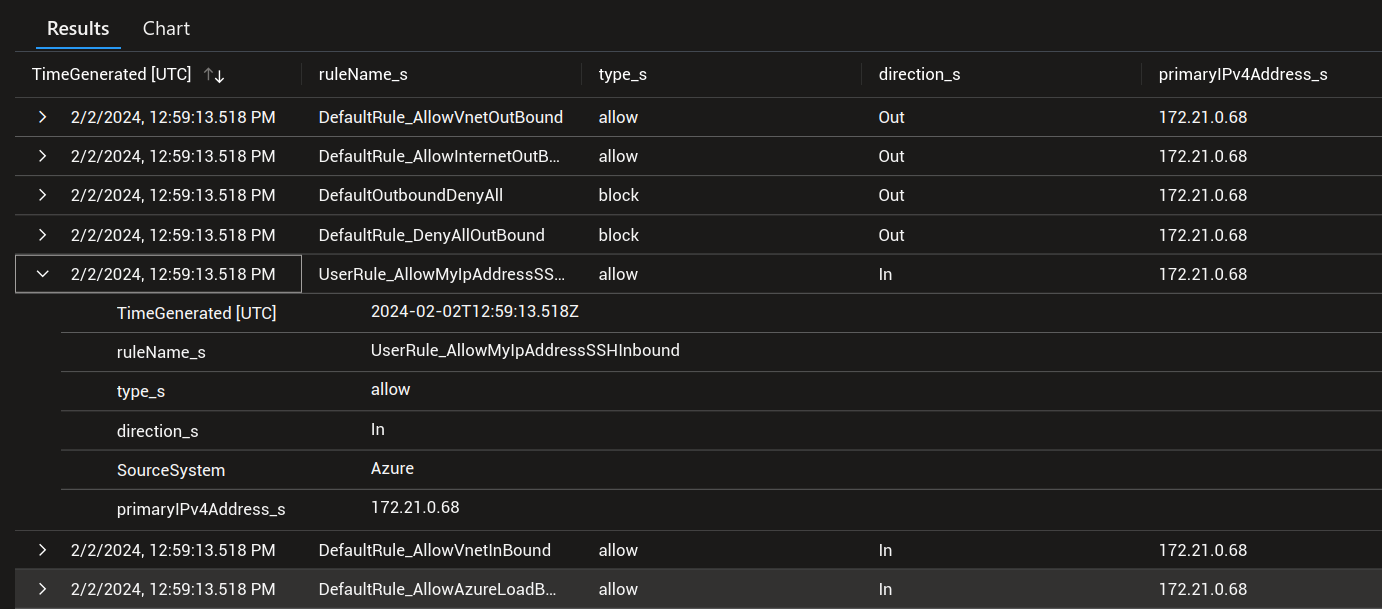
We’ll note the difference displayed in the logs between default nsg rules, prefixed with DefaultRule_ and custom rules, prefiexed with UserRule_
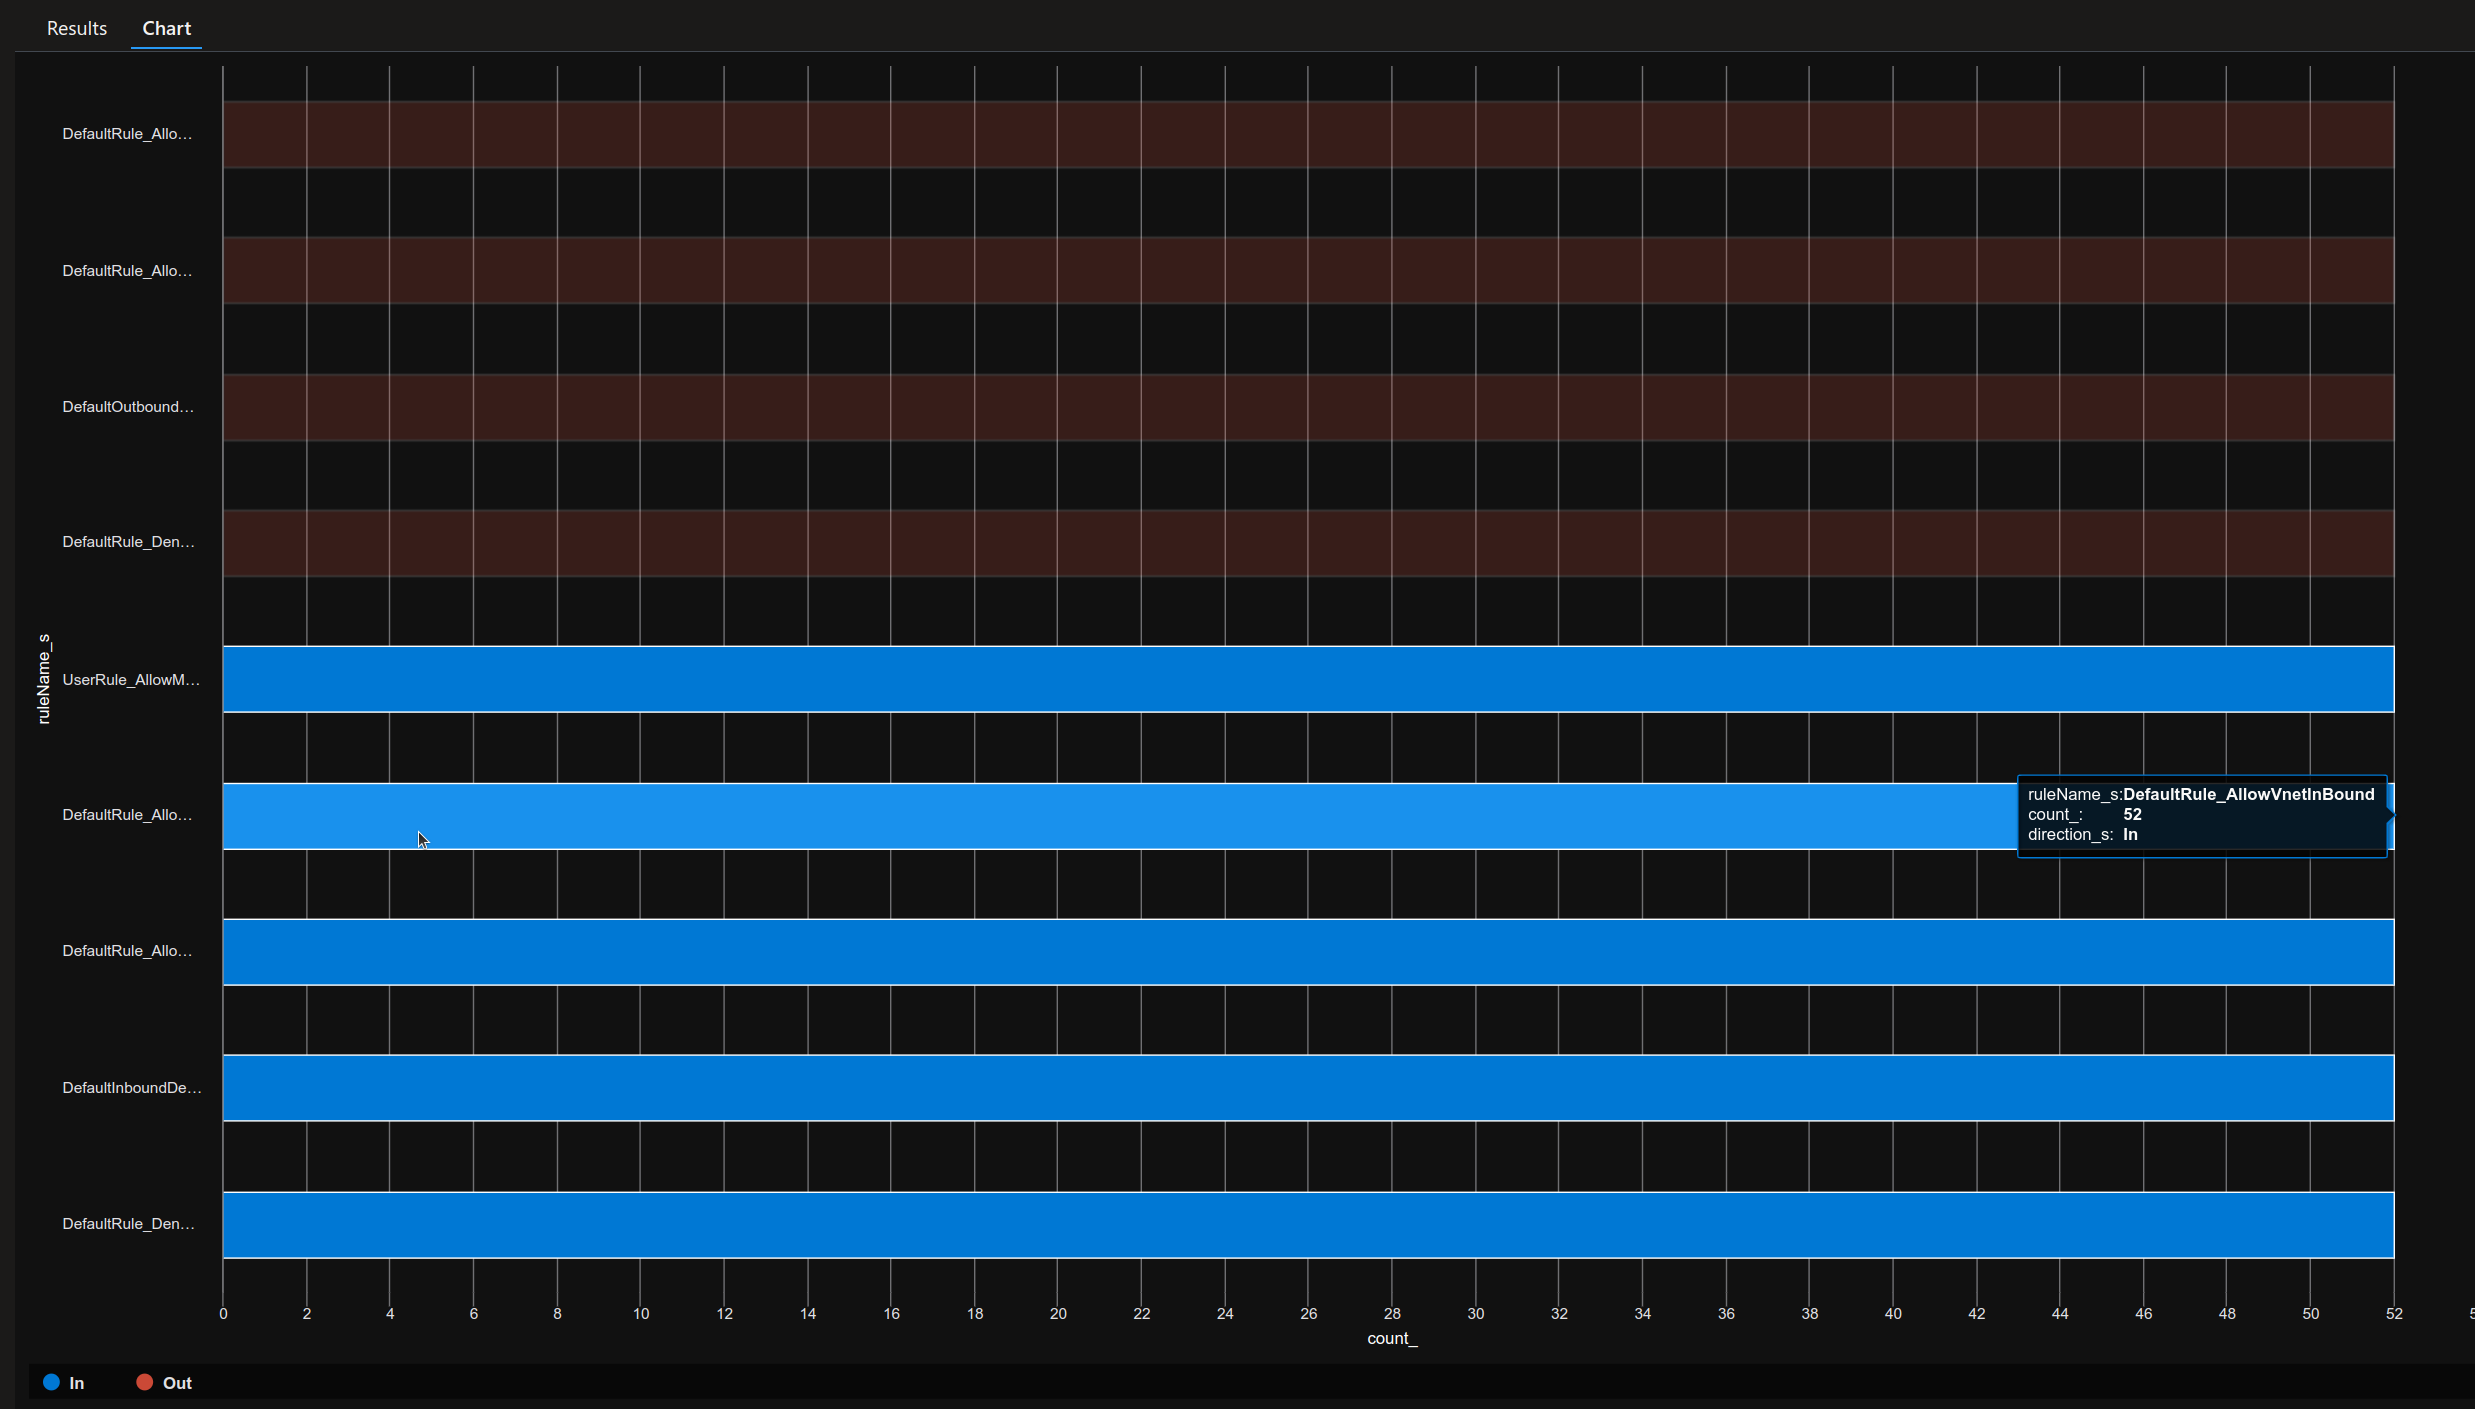
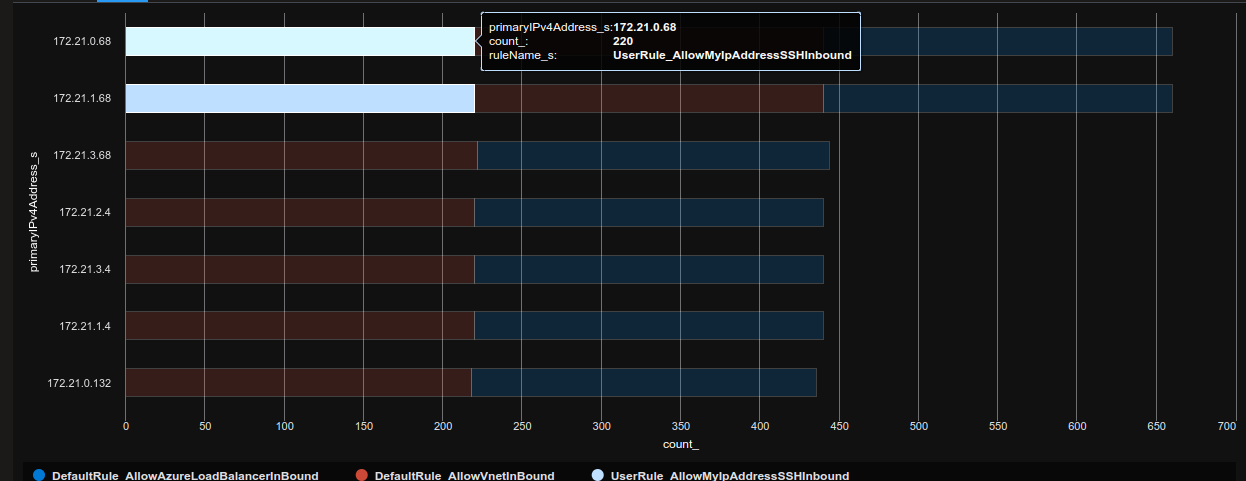
Let’s add the summarize and render verbs, and create a diagram:
AzureDiagnostics
| where TimeGenerated >= ago(24h)
| where Category == "NetworkSecurityGroupRuleCounter"
| where ResourceId == "/SUBSCRIPTIONS/00000000-0000-0000-0000-000000000000/RESOURCEGROUPS/<rGName>/PROVIDERS/MICROSOFT.NETWORK/NETWORKSECURITYGROUPS/<nsgName>"
| project TimeGenerated,ruleName_s,type_s,direction_s,SourceSystem,primaryIPv4Address_s
| summarize count() by ruleName_s, direction_s
| render barchart
AzureDiagnostics
| where TimeGenerated >= ago(24h)
| where Category == "NetworkSecurityGroupRuleCounter"
| where ResourceId contains "PROVIDERS/MICROSOFT.NETWORK/NETWORKSECURITYGROUPS/"
| project TimeGenerated,ruleName_s,type_s,direction_s,SourceSystem,primaryIPv4Address_s
| summarize count() by ruleName_s, direction_s
| render barchart
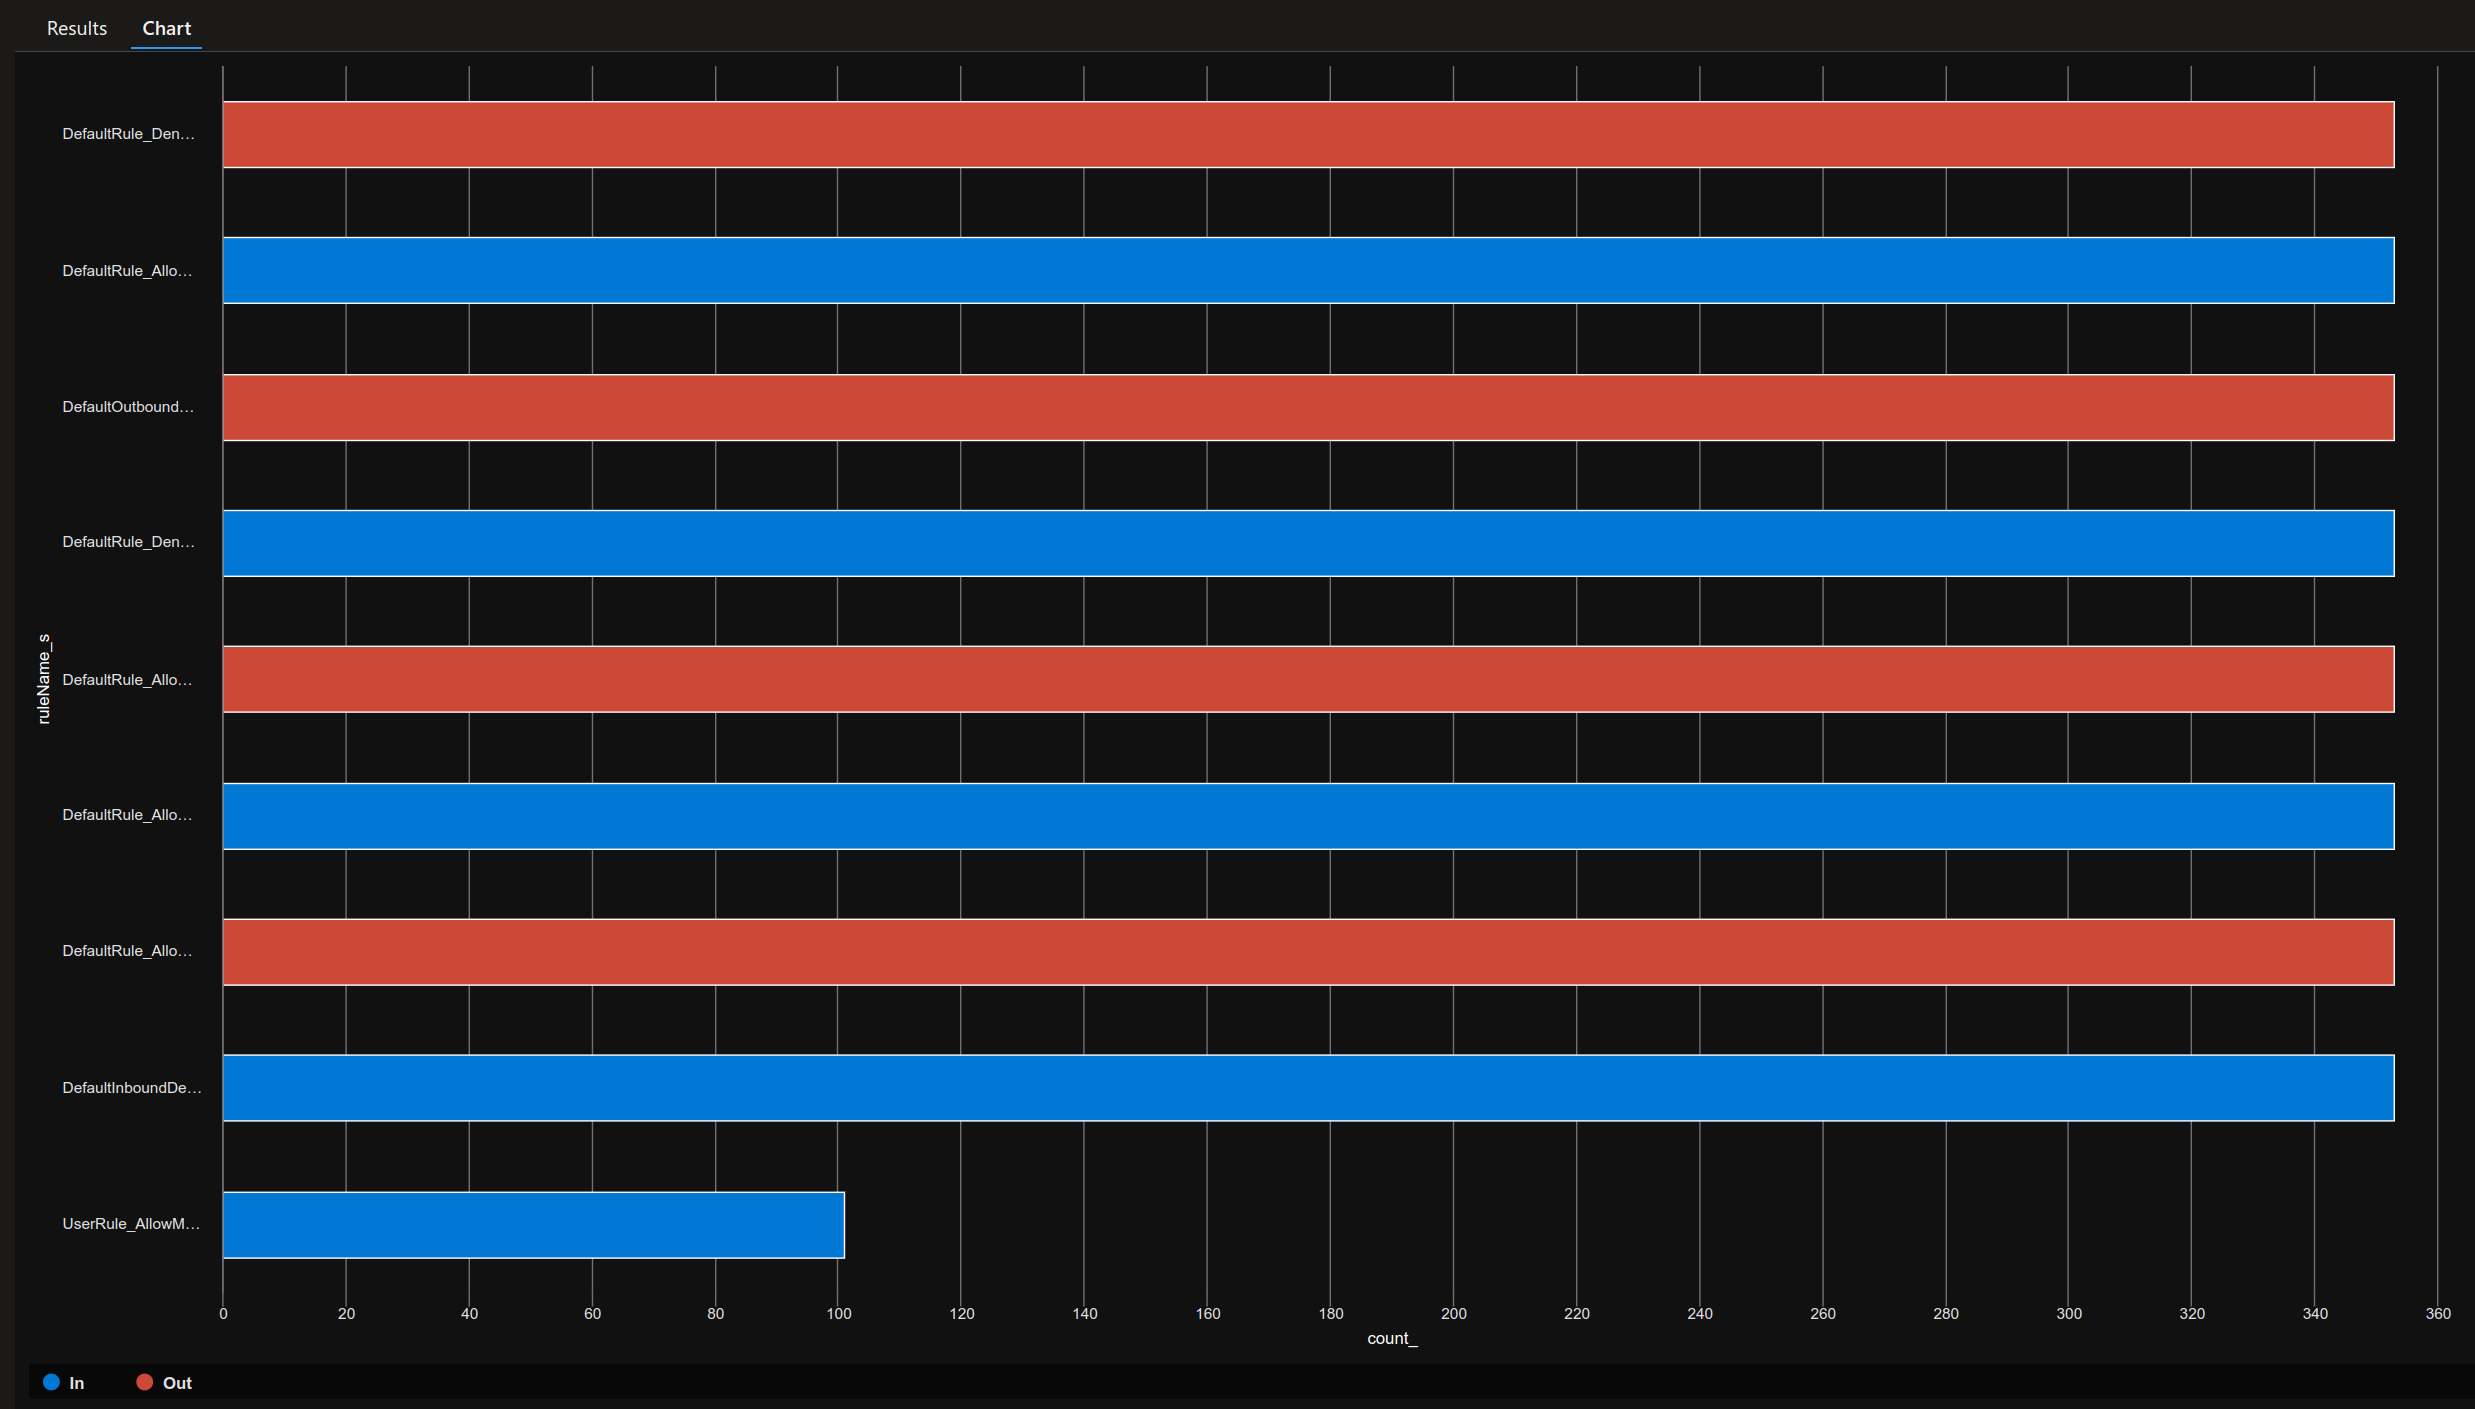
So that’s not bad, but not enough for Network troubleshhoting, if we need any, so let’s move forward and start displaying information in the flows
4. Display informations on flows
Using the category Network Security Group Event, we can get additional informations and filter traffic depending on source or destination IP.
However, here, we can only use conditions_sourceIP_s and conditions_destinationIP_s to use as filter on the IPwhich display informaiton on the ip that was evaluated in the rule. But we’ll see that there are limits.
The parameter conditions_destinationPortRange_s gives information on the port that the flows are trying to reach.
The parameter primaryIPv4Address_s can be useful to display information on the targeted IP.
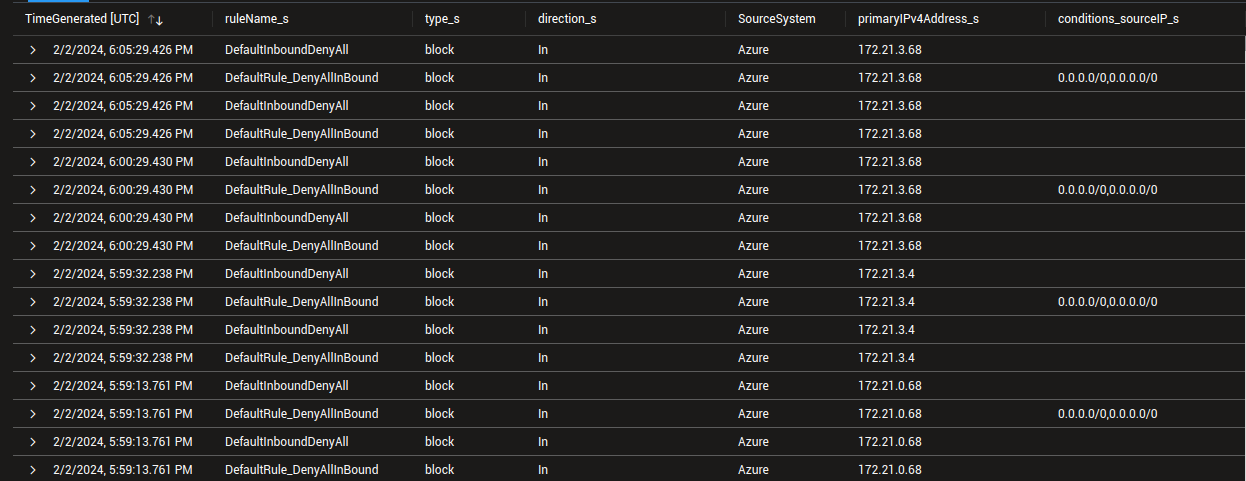
The below query display the ingress flows blocked on a chosen NSG. In this case there is only 1 VM associated with this NSG.
AzureDiagnostics
| where TimeGenerated >= ago(24h)
| where Category == "NetworkSecurityGroupEvent"
| where ResourceId == "/SUBSCRIPTIONS/00000000-0000-0000-0000-000000000000/RESOURCEGROUPS/<rGName>/PROVIDERS/MICROSOFT.NETWORK/NETWORKSECURITYGROUPS/<nsgName>"
| where direction_s == "In"
| where type_s == "block"
| project TimeGenerated,ruleName_s,type_s,direction_s,SourceSystem,primaryIPv4Address_s, conditions_sourceIP_s, conditions_destinationIP_s, conditions_destinationPortRange_s, ResourceType, ResourceId
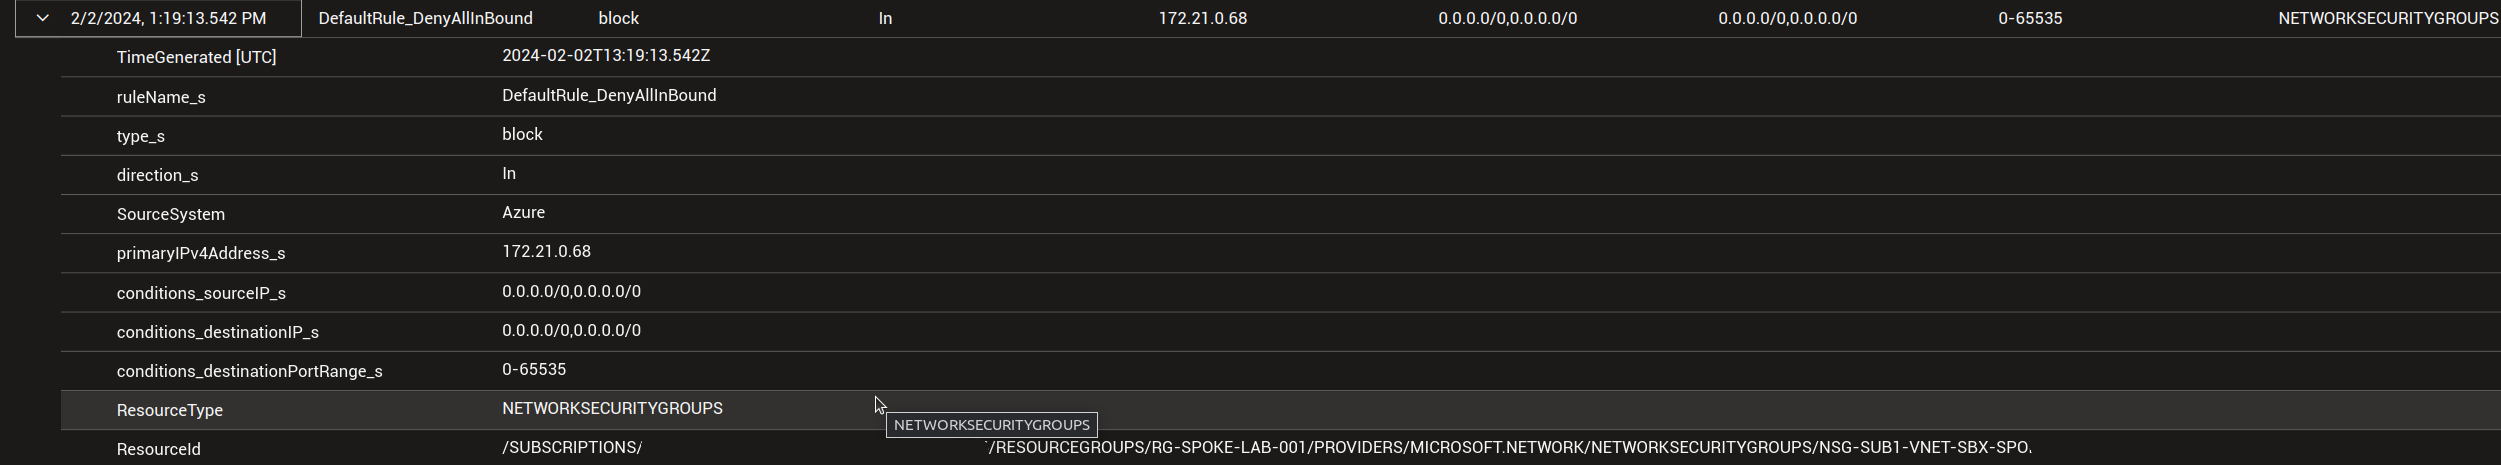
On the results displayed, we can see interesting informations on the way the logs are displayed.
- first, the parameter
primaryIPv4Address_sgives, in this case, only information on the target IP - second, the source IP is not well identified here, an we can either see
conditions_sourceIP_sequals to0.0.0.0/0,0.0.0.0/0or not defined. It completely depends on the nature of the rule here. If the rule specifies an IP in the source, then, this IP is displayed inconditions_sourceIP_s. In the example, the rule is the default ruleDefaultRule_DenyAllInBound, which is coded as below in the portal:
| priority | name | direction | access | protocol | source Port Range(s) | destination Port Range(s) | source Address Prefix(es) | destination Address Prefix(es) |
|---|---|---|---|---|---|---|---|---|
| 65500 | DenyAllInBound | Inbound | Deny | * | * | * | * | * |
Because the source IP defined is *, we get 0.0.0.0/0,0.0.0.0/0 in the logs.
Let’s see with the allowed ingress flows now. For that we’ll change the value of the parameter type_s to allow. We’ll also switch from a specific resource id to a more broad research to get information on more than one NSG:
AzureDiagnostics
| where TimeGenerated >= ago(24h)
| where Category == "NetworkSecurityGroupEvent"
| where ResourceId contains "PROVIDERS/MICROSOFT.NETWORK/NETWORKSECURITYGROUPS/"
| where direction_s == "In"
| where type_s == "allow"
| project TimeGenerated,ruleName_s,type_s,direction_s,SourceSystem,primaryIPv4Address_s, conditions_sourceIP_s, conditions_destinationIP_s, conditions_destinationPortRange_s, ResourceType, ResourceId
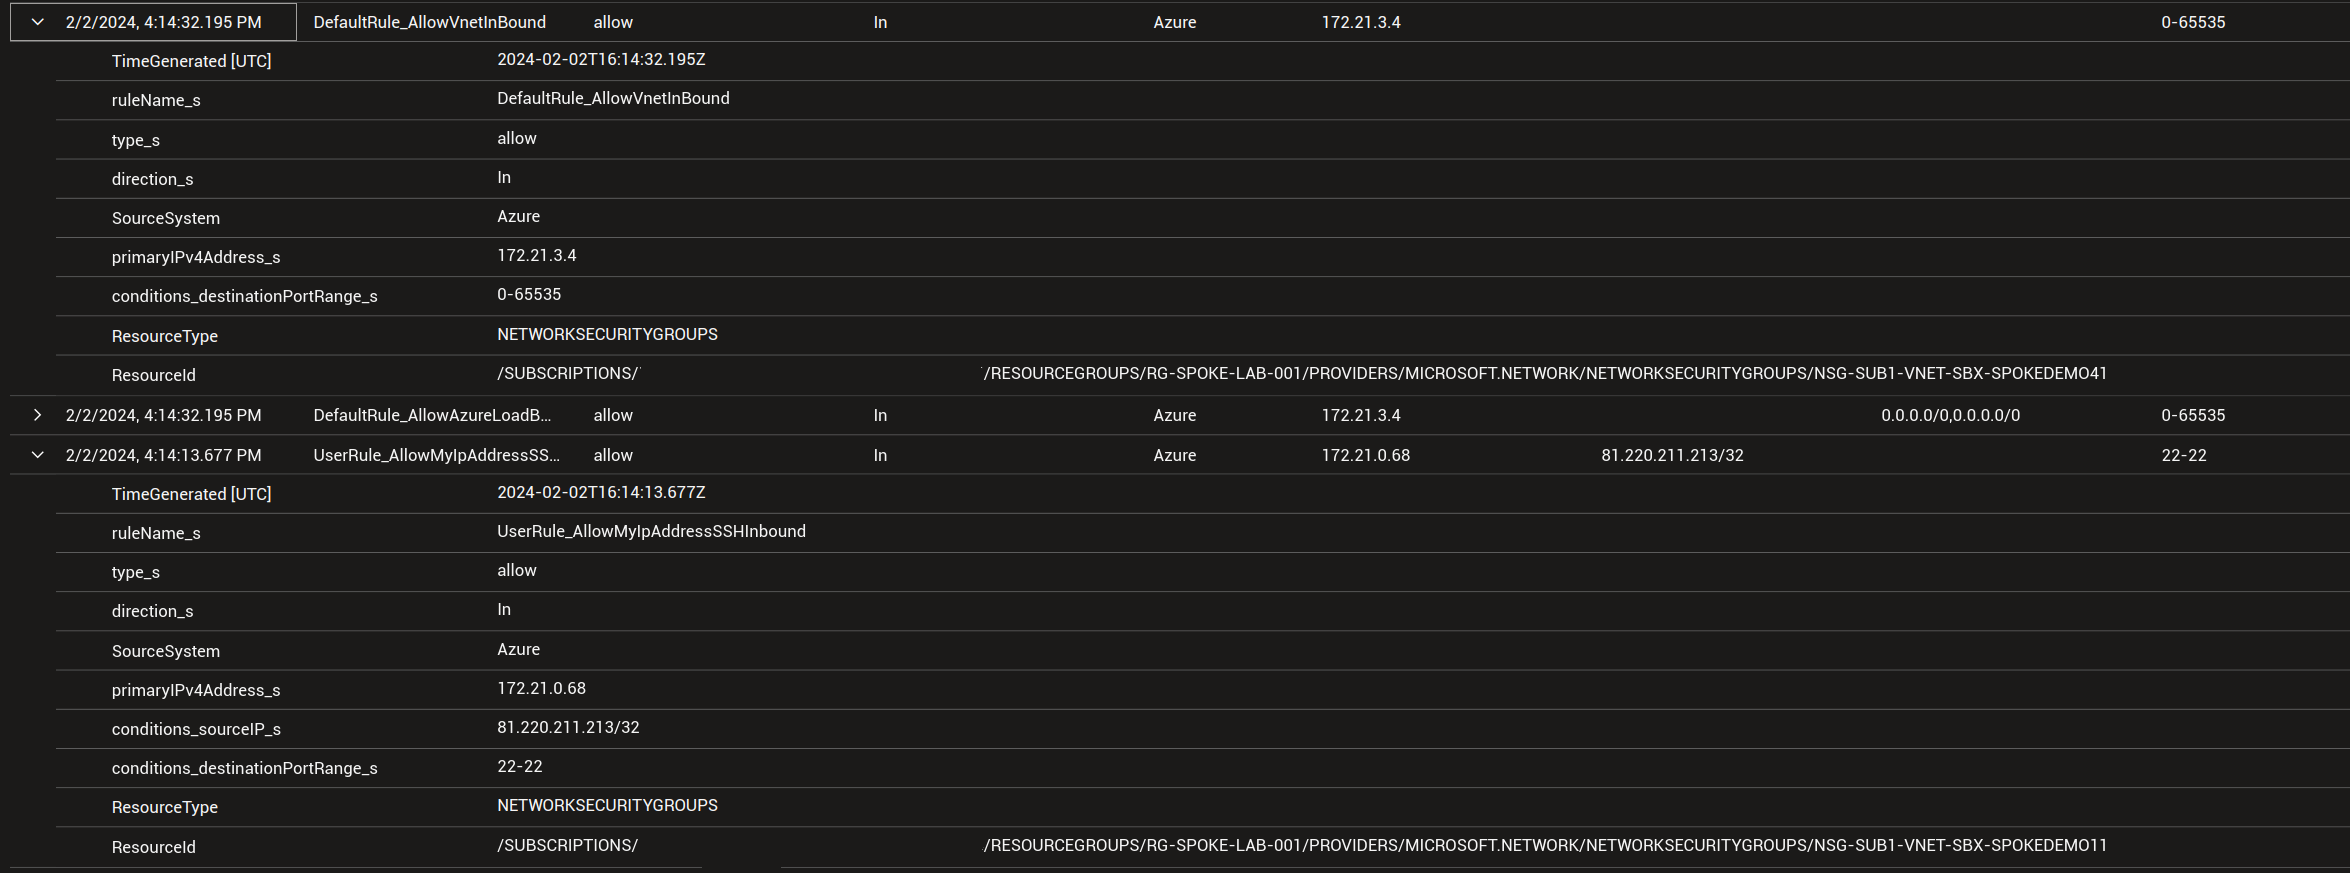
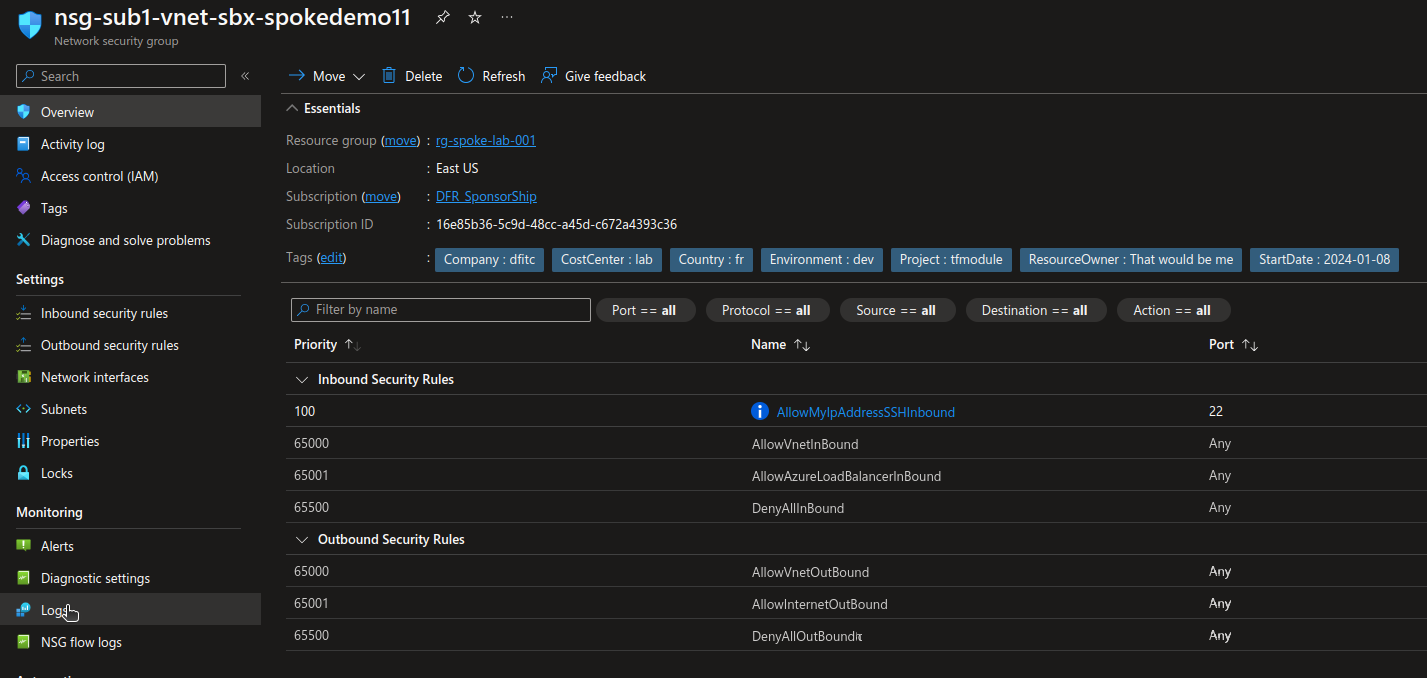
As we can see, we have on one entry a reference to a public IP that is allowed for SSH. The associated rule is as below, and we can see that the IP is specifically mentionned in the rule and thus visible in the log.
Note: In this rule, WebServer refers to an Application Security Group.
| priority | name | direction | access | protocol | source Port Range(s) | destination Port Range(s) | source Address Prefix(es) | destination Address Prefix(es) |
|---|---|---|---|---|---|---|---|---|
| 100 | AllowMyIpAddressSSHInbound | Inbound | Allow | TCP | * | 22 | My_Public_Ip |
WebServer |
The other entry is on another NSG and we can only see that the traffic is allowed by the default rule DefaultRule_AllowVnetInBound.
However, because there is no reference in the default rules to spceific IP, we do not get information in the conditions_sourceIP_s.
To get egress flow blocked, we just have to change the direction_s parameter value from In to Out
The below query display the egress flows blocked:
AzureDiagnostics
| where TimeGenerated >= ago(24h)
| where Category == "NetworkSecurityGroupEvent"
| where ResourceId == "/SUBSCRIPTIONS/00000000-0000-0000-0000-000000000000/RESOURCEGROUPS/<rGName>/PROVIDERS/MICROSOFT.NETWORK/NETWORKSECURITYGROUPS/<nsgName>"
| where direction_s == "Out"
| where type_s == "block"
| project TimeGenerated,ruleName_s,type_s,direction_s,SourceSystem,primaryIPv4Address_s, conditions_sourceIP_s, conditions_destinationIP_s, conditions_destinationPortRange_s, ResourceType, ResourceId
The below query will get the Egress flow allowed
AzureDiagnostics
| where TimeGenerated >= ago(24h)
| where Category == "NetworkSecurityGroupEvent"
| where ResourceId == "/SUBSCRIPTIONS/00000000-0000-0000-0000-000000000000/RESOURCEGROUPS/<rGName>/PROVIDERS/MICROSOFT.NETWORK/NETWORKSECURITYGROUPS/<nsgName>"
| where direction_s == "Out"
| where type_s == "allow"
| project TimeGenerated,ruleName_s,type_s,direction_s,SourceSystem,primaryIPv4Address_s, conditions_sourceIP_s, conditions_destinationIP_s, conditions_destinationPortRange_s, ResourceType, ResourceId
An interesting fact: while earlier, the primaryIPv4Address_s was refering to the target IP, this time, it’s the source IP.
It does make sense, considering that the NSG is a distributed firewall associated to the NIC.
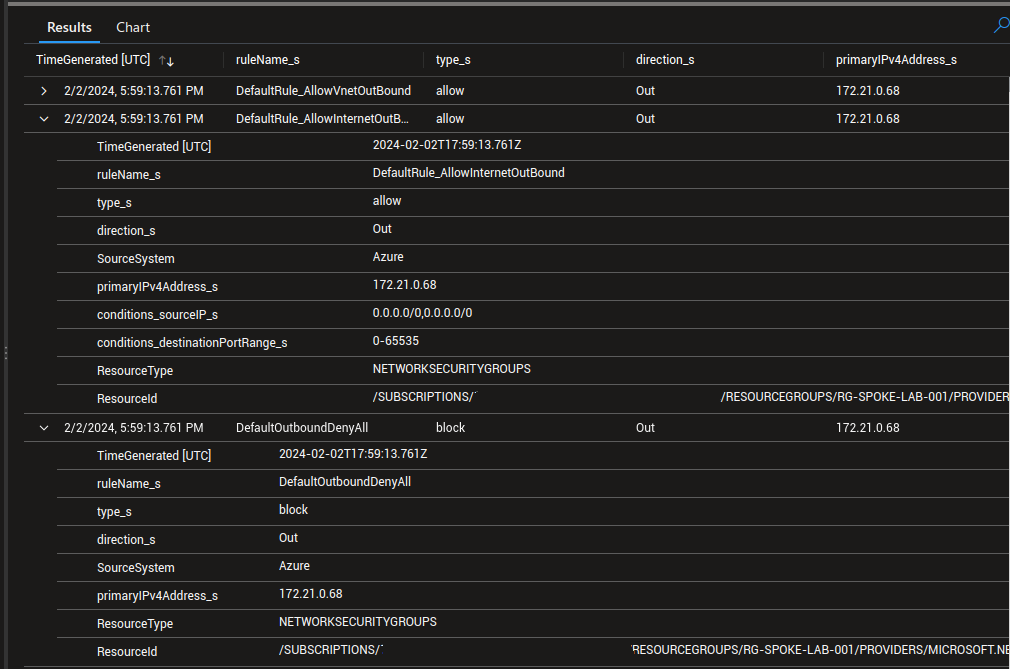
This means that investigating flows with the diagnostic settings logs should be done considering the direction of the flows first. Then It’s possible to look flows on a specific machine/IP.
For example, we can use this query to identify all the allowed flows in our logs:
AzureDiagnostics
| where TimeGenerated >= ago(4d)
| where direction_s == "In"
| where type_s == "allow"
| project TimeGenerated,ruleName_s,type_s,direction_s,SourceSystem,primaryIPv4Address_s, conditions_sourceIP_s, conditions_destinationIP_s, conditions_destinationPortRange_s, ResourceType, ResourceId
//| summarize count() by primaryIPv4Address_s, ruleName_s
//| render barchart
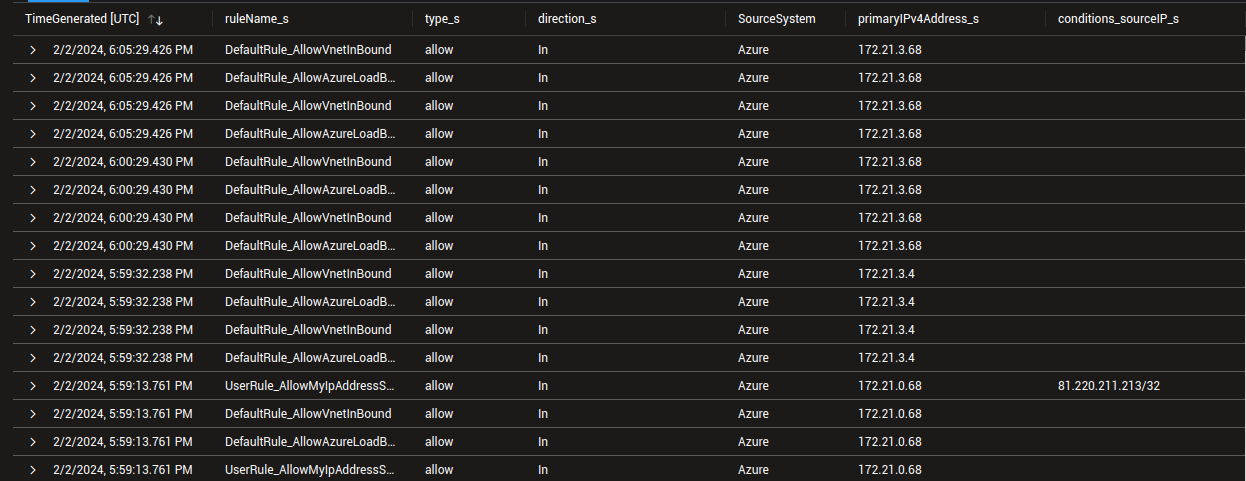
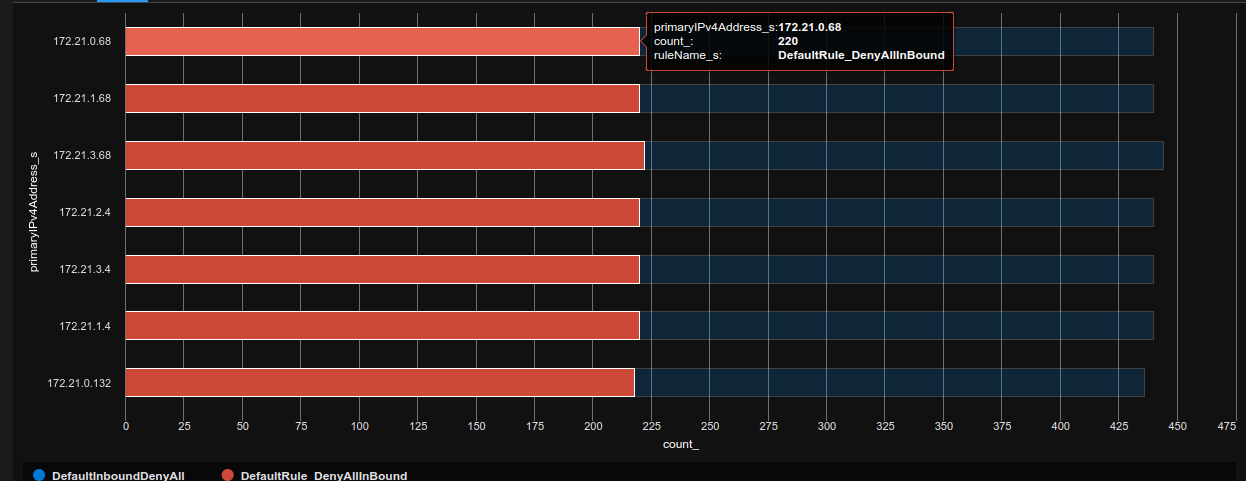
If we add the lines | summarize count() by primaryIPv4Address_s, ruleName_s and | render barchart , by removing the // in front, we get a nice summarizing chart
If we just change the parameter type_s value to block, we get the denied flows.
But we do not really get a full picture of the flows, as we only get either the Azure destination IP, or the Azure Source IP. Ok, let’s wrap up
5. Summary
So what have we seen? First, the Azure resource logs on the NSGs can give us some information on flows going through NSG. With some simple queries, we get statistics on the rules responsible for allowed or denied flows. Second, we get different informations depending of the rules. A rule with a specific IP tagged in it wil gives us more details than a generic rule with a wide range (in source ou destination address). Third, well, it’s a corollary of the second point, while we can get information from the NSG diagnostic settings, this is far from complete. We cannot identify a source IP that try to reach a workload associated to the NSG, nor can we identify which IP is trying to reach an Azure workload if it’s not clearly specified in the rule. So this is far from complete, an dnot totally helpfull for troubleshooting.
We’ll stop here for today, but just so you know, we do have means for network flows troubleshooting, and the NSG flow logs to get more visibility on those flows.
That’s all for today! See you soon ^^