What if I want to see Network Logs on Azure? - Part2
Hello everyone!
This is part 2 of our journey to Network observability on Azure. In part1, we review some basics and start playing with NSG diagnostics logs. While giving us some informations, it was far from enough to get specific information, mainly due to the log structure, which will refers the source or destination IP depending on the rule condition. Fortunately, we do have flow logs to get much more visibility.
Let’s get started!
1. Azure Network Watcher, Traffic Analytics and flow logs
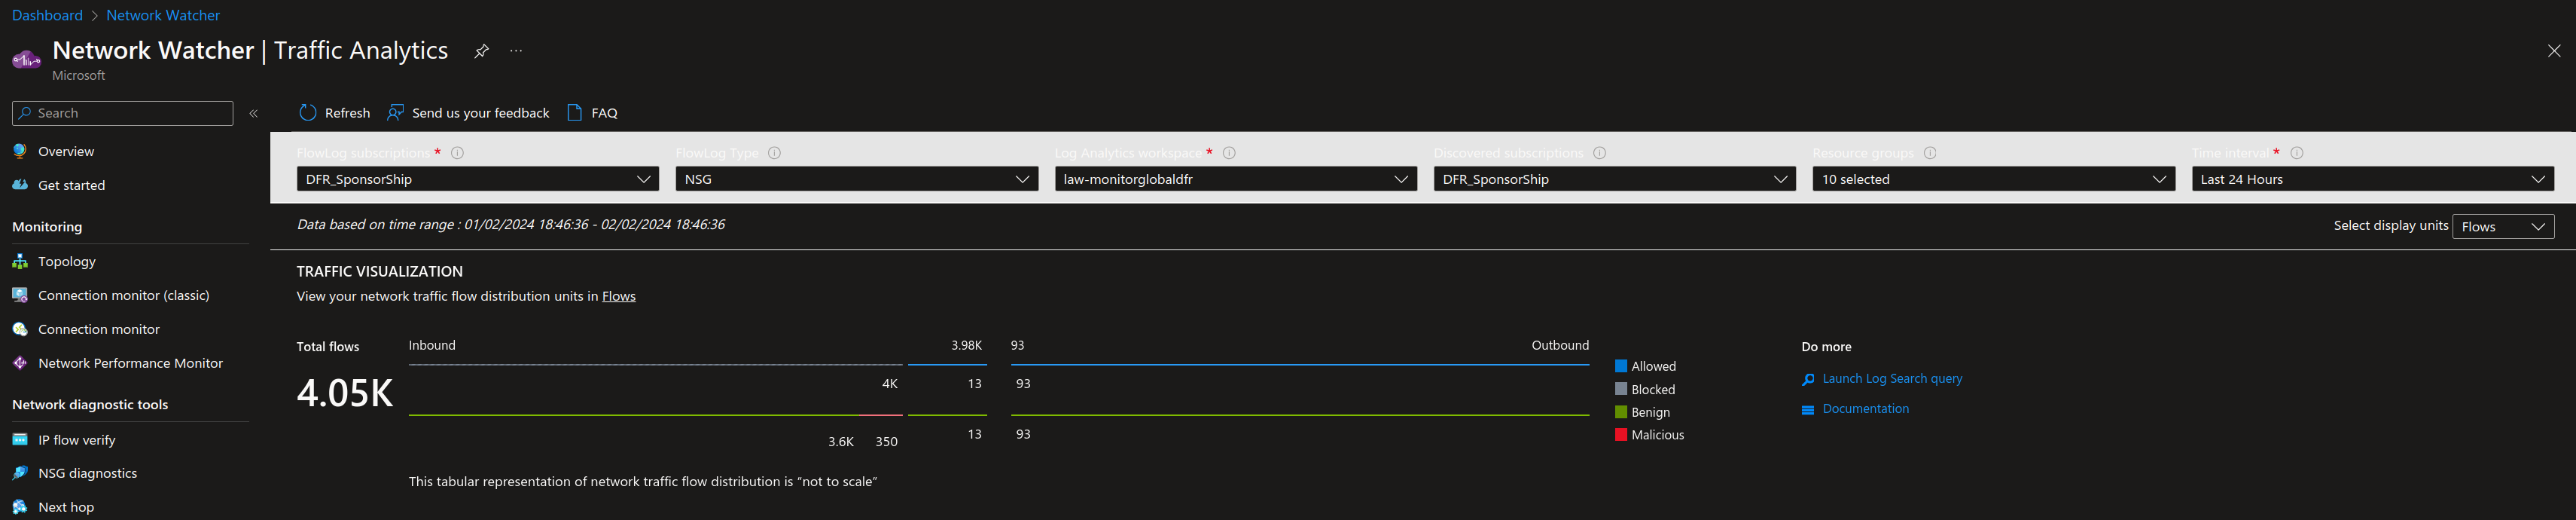
As the title suggest, Flow logs are a feature of Azure Network watcher and are actually the foundations behind Traffic analytic.
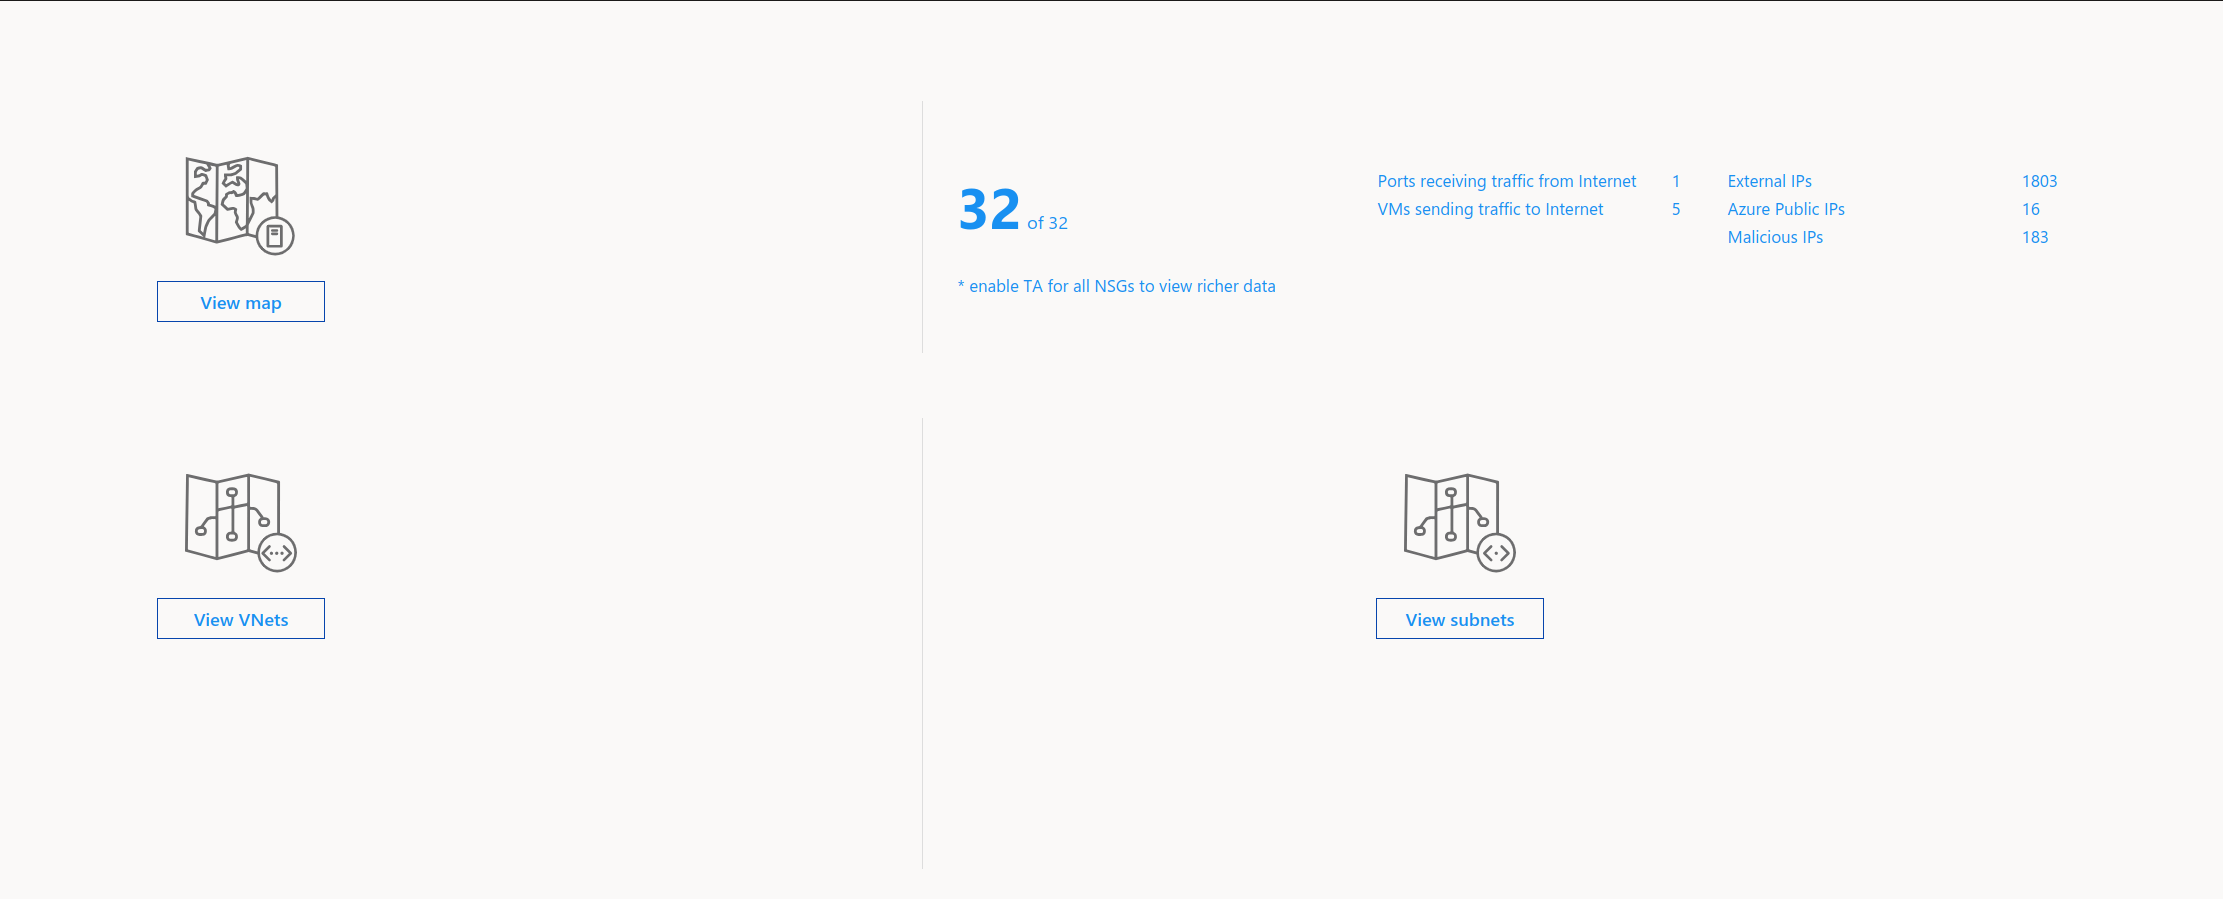
Traffic Analytics provides, as the name implies, some basics analytics on the Network flows directly in the portal.
Before anything, we would need to configure flow logs on NSGs. As opposite to diagnostic settings, which are related resources to the NSG, a flow log is created as an independant resource, related to Azure Network Watcher.
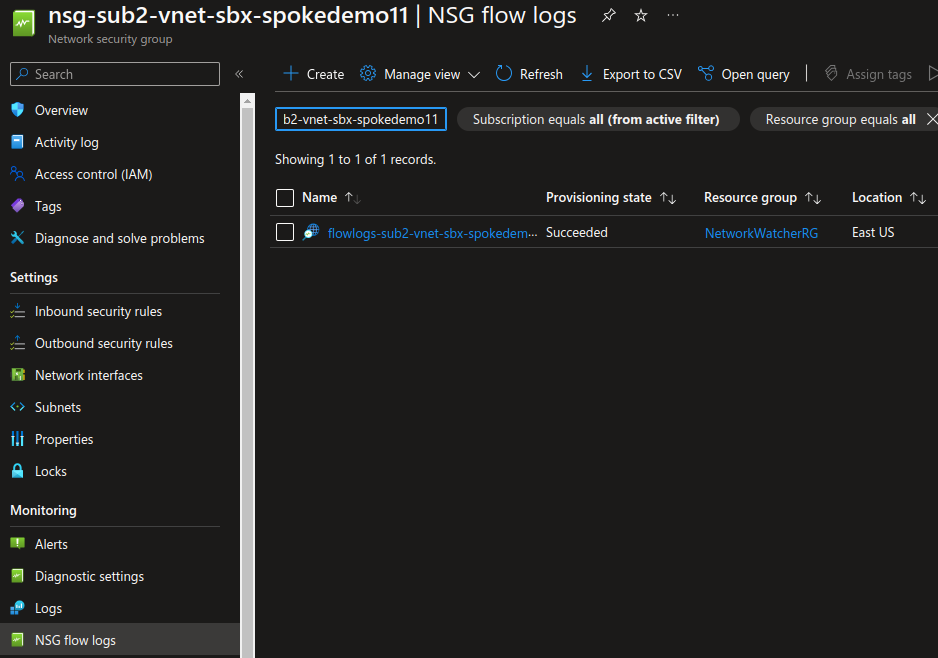
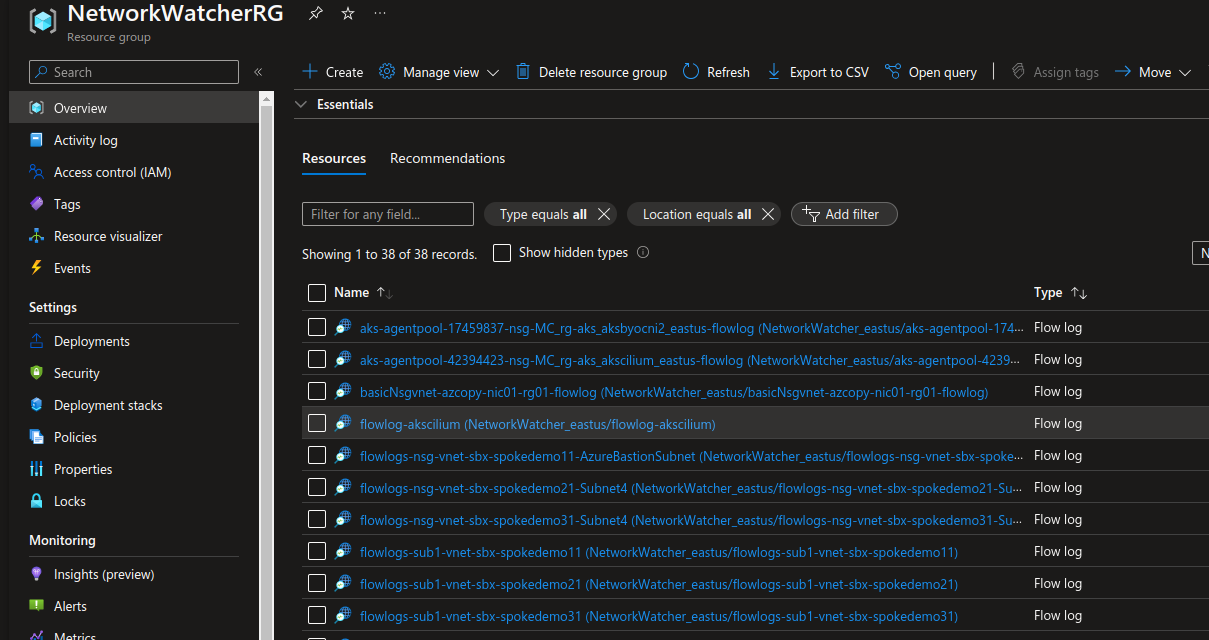
Creating flow log resources can be done through the portal, or through some terraform configuration as displayed below.
resource "azurerm_network_watcher_flow_log" "Flowlogs" {

  for_each = local.Subnets

  network_watcher_name      = local.NetworkWatcherName
  name                      = local.Subnets[each.key].Nsg.FlowLogName
  location                  = var.Location
  resource_group_name       = local.NetworkWatcherRGName
  network_security_group_id = azurerm_network_security_group.Nsgs[each.key].id
  storage_account_id        = local.StaLogId
  enabled                   = true
  version                   = 2

  retention_policy {
    enabled = true
    days    = 365
  }

  traffic_analytics {
    enabled               = var.IsTrafficAnalyticsEnabled #true
    workspace_id          = data.azurerm_log_analytics_workspace.LawLog.workspace_id
    workspace_region      = data.azurerm_log_analytics_workspace.LawLog.location
    workspace_resource_id = data.azurerm_log_analytics_workspace.LawLog.id
    interval_in_minutes   = 10
  }
}
It can also be configured through an Azure Policy, which allow to remediate automatically NSGs without flow logs.
It’s quite easy to get interesting informations directly from the portal, once flow logs are configured with a Log Analytics Workspace.

Someone searching a little should find at one point a kusto query behind GUI, as below.
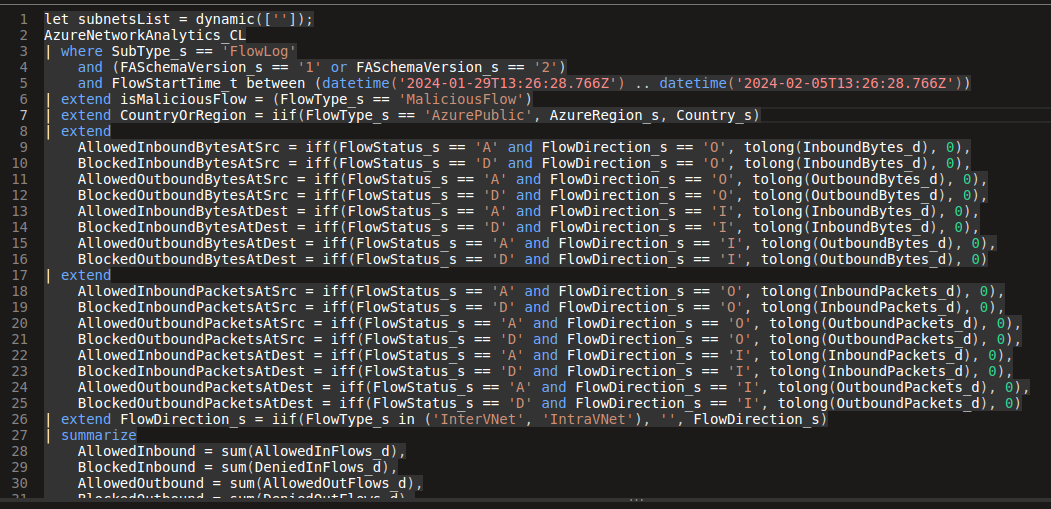
that one is a bit more advanced than what we’ve seen up now, so let’s start from the beginning.
2. Querying flow logs
For flow logs, the log category that we are interested in is AzureNetworkAnalytics_CL, and in all the examples, we’ll also specify SubType_s == 'FlowLog'
A basic query would then be like this:
AzureNetworkAnalytics_CL
| where SubType_s == 'FlowLog'
| where TimeGenerated >= ago(24h)
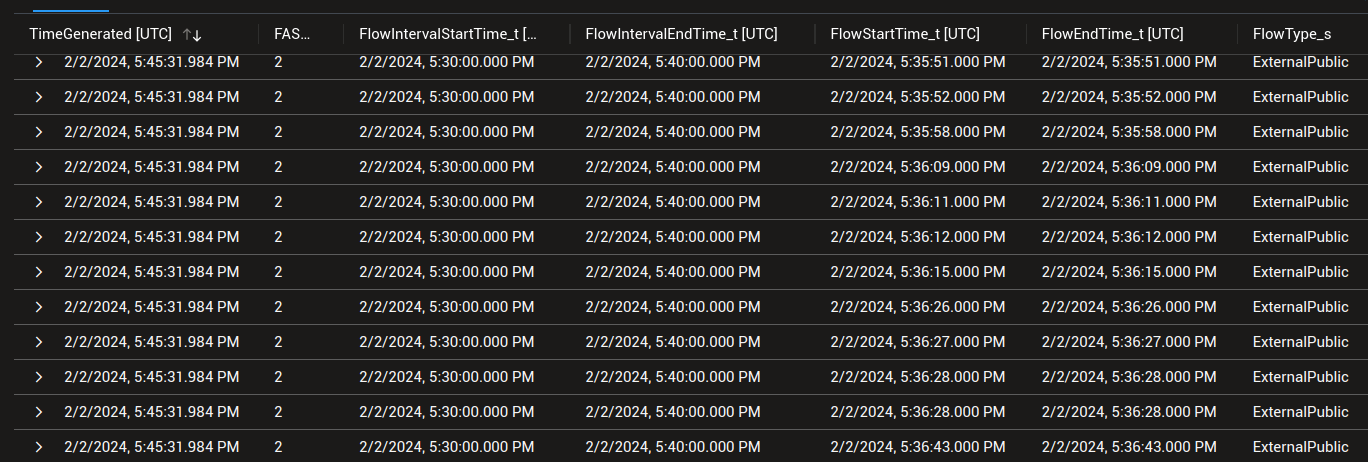
If we expand one of the result, we can see taht we have much more details thant with the diagnostic logs.
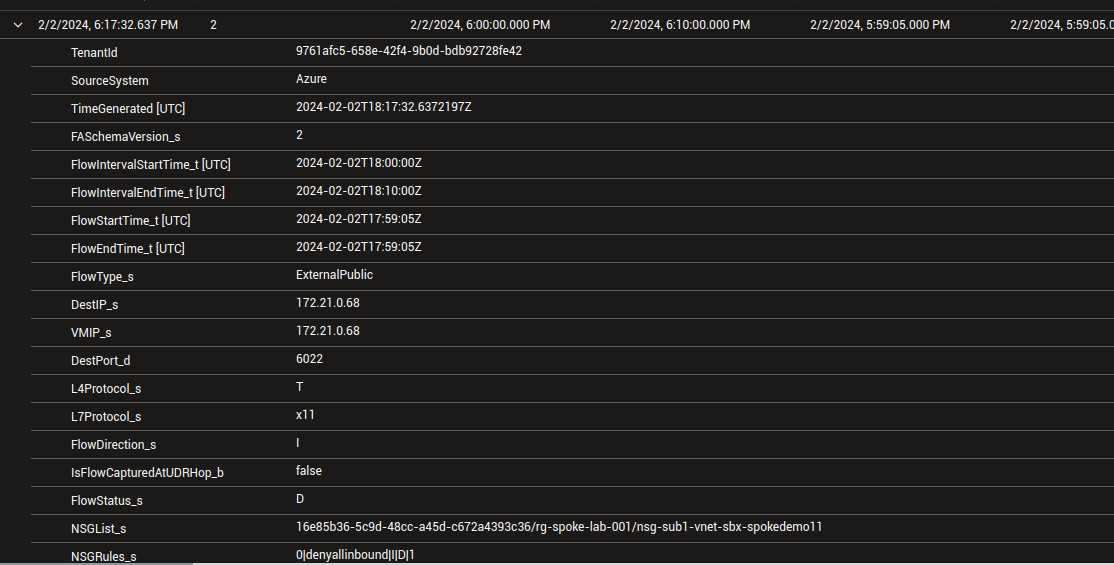
There are a bunch of interesting argument that can give us the information that we want.
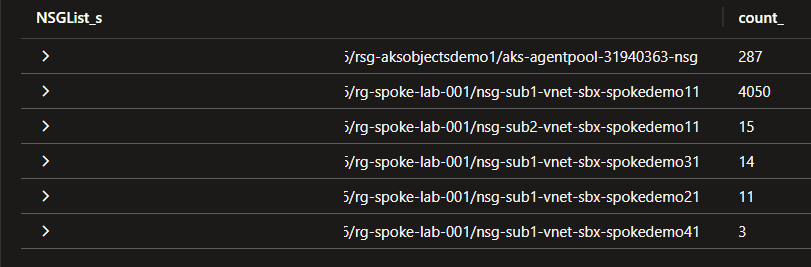
First of all, the parameter NSGList_s allows to filter on a specific Networ Security Group. However, while we specify the resource id in Diagnostic settings log based query, in this case, the NSGList_s is in the form 00000000-0000-0000-0000-000000000000/<rgName>/<nsgName>.
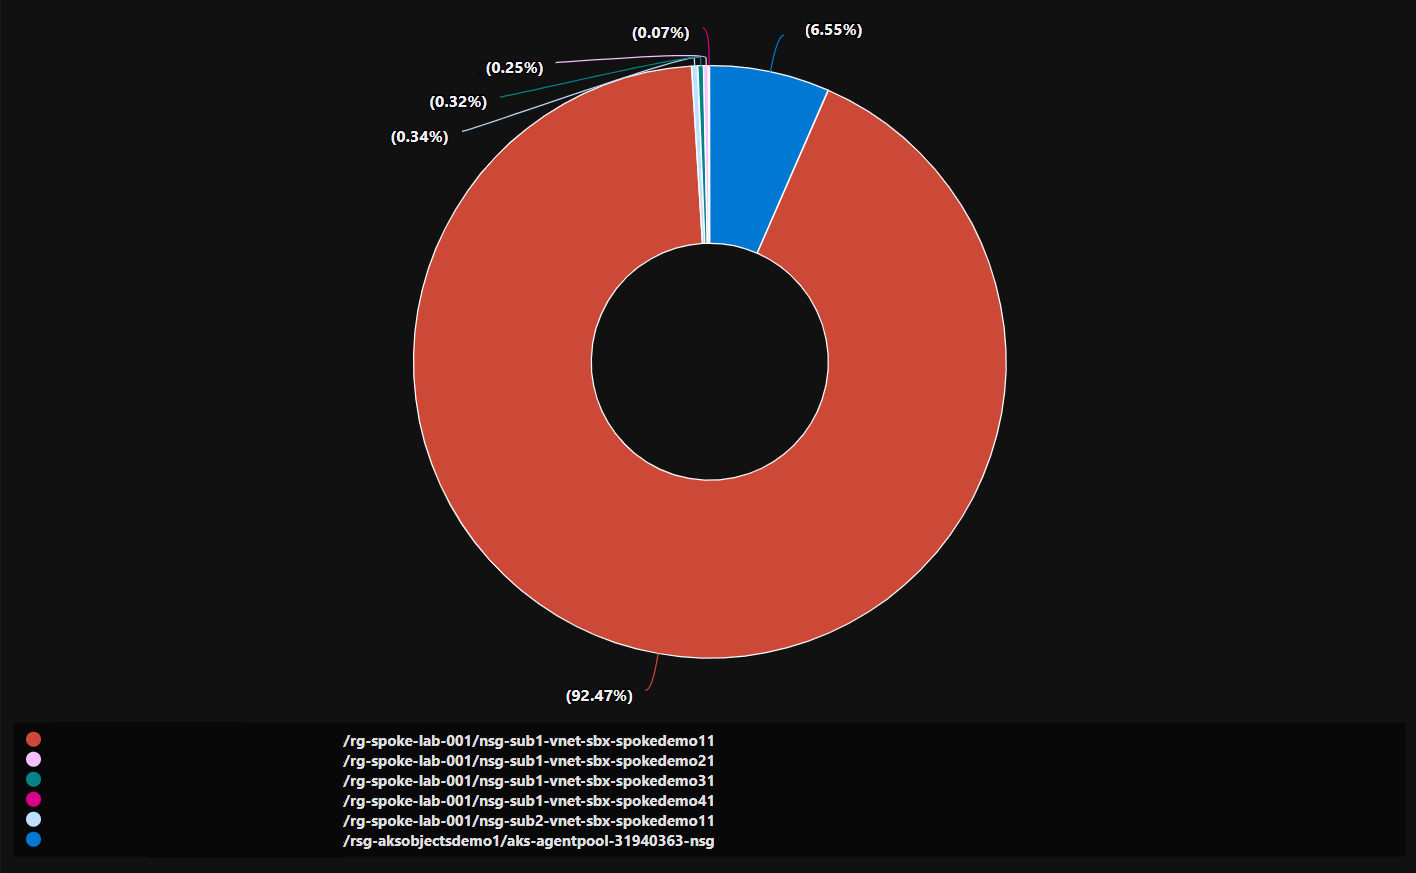
The below query gives us the total flows per NSG.
AzureNetworkAnalytics_CL
| where SubType_s == 'FlowLog'
| where TimeGenerated >= ago(7d)
| summarize count() by NSGList_s
| render piechart
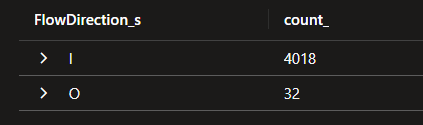
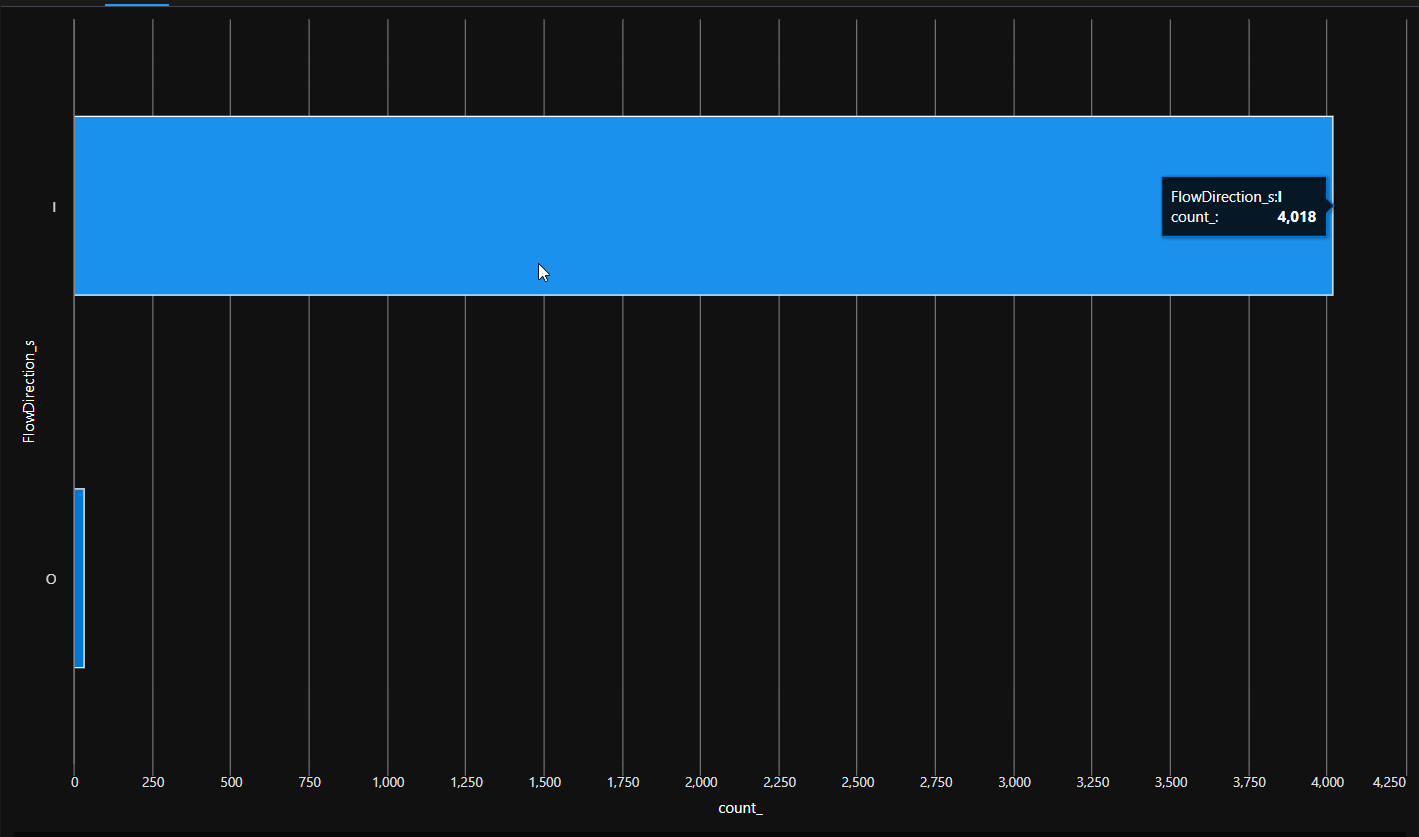
FlowDirection_s gives indication on the direction of the flow, It can be I for Inbound, or O for Outbound. The query below gives the number of flows for a specific NSG, differentiated per direction.
AzureNetworkAnalytics_CL
| where SubType_s == 'FlowLog'
| where TimeGenerated >= ago(7d)
| where NSGList_s == '00000000-0000-0000-0000-000000000000/<RgName>/<NsgName>'
| summarize count() by FlowDirection_s
| render barchart
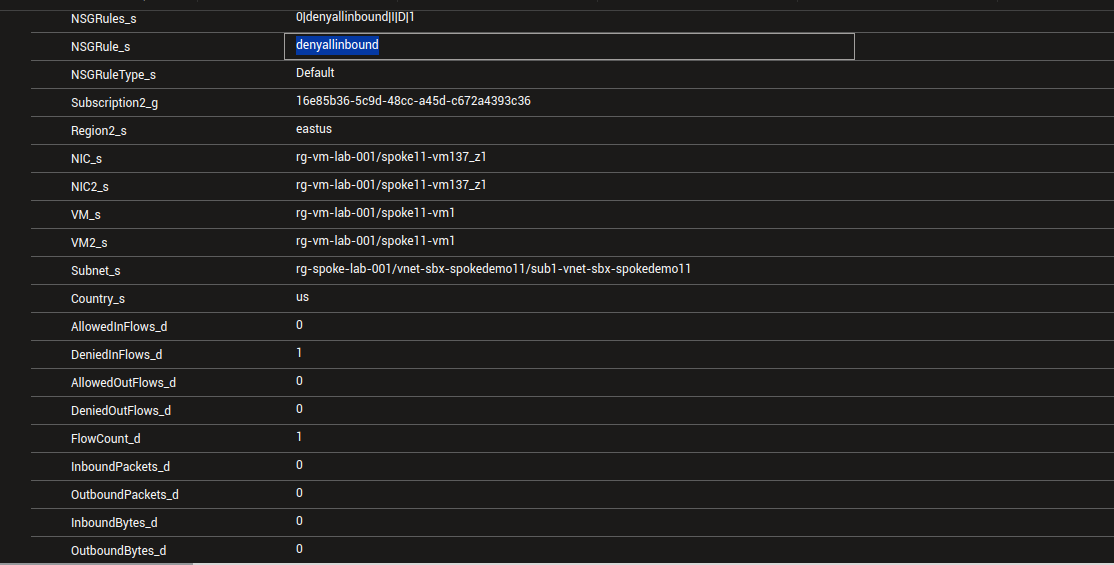
Again, similarly to Diagnostic Settings logs, we can get informations on the rule generating the log with the parameter NSGRule_s, NSGRuleType_s adn to some extent NSGRules_s.
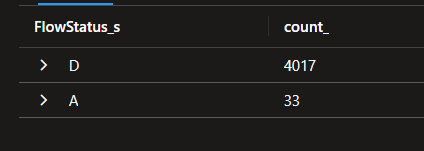
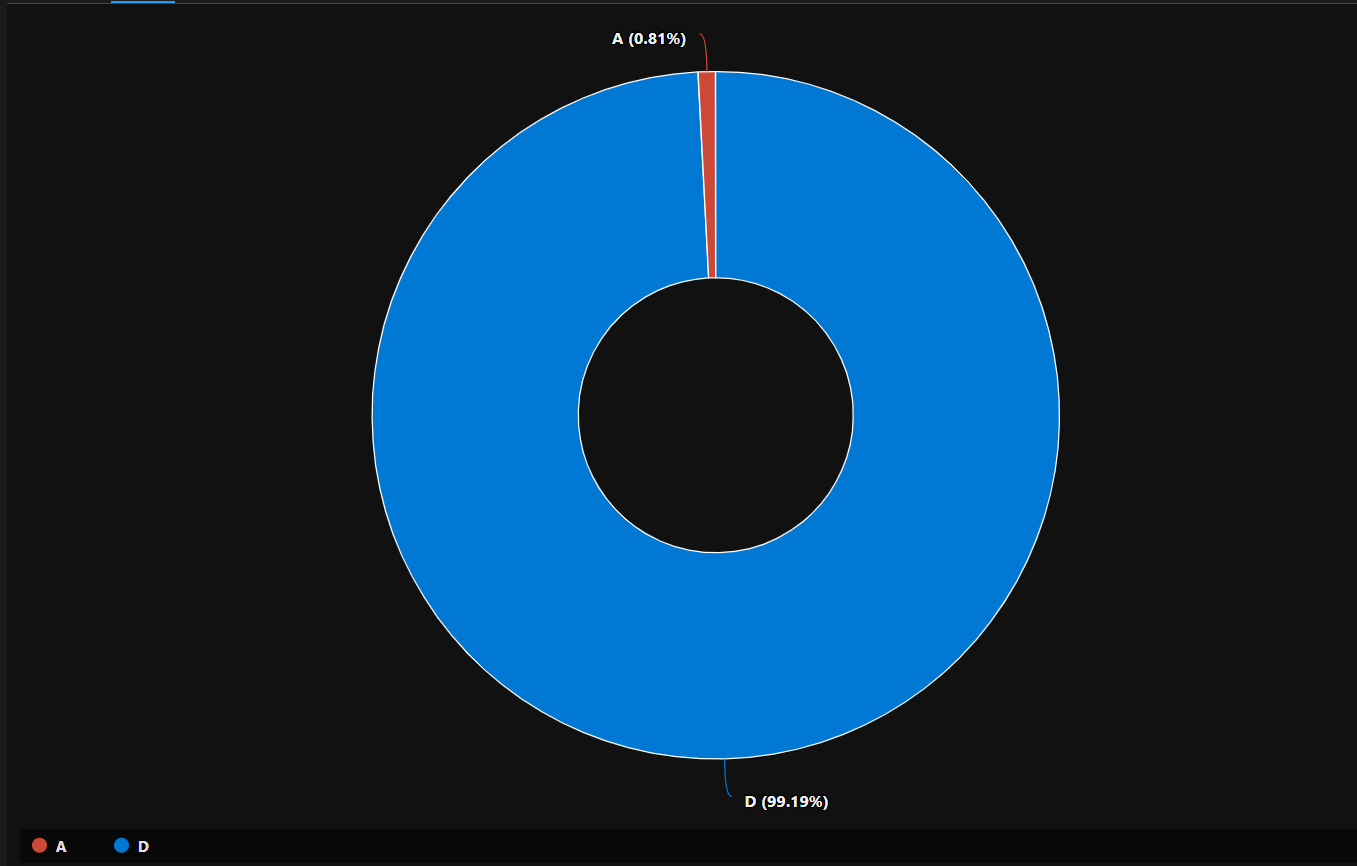
It’s also possible to identify if a flow was allowed or denied with the argument FlowStatus_s
AzureNetworkAnalytics_CL
| where SubType_s == 'FlowLog'
| where TimeGenerated >= ago(7d)
| where NSGList_s == '00000000-0000-0000-0000-000000000000/<RgName>/<NsgName>'
| summarize count() by FlowStatus_s
| render piechart
There other additional argumetns that give more information on the flows such as L4Protocol_s, L7Protocol_s or DestPort_d.
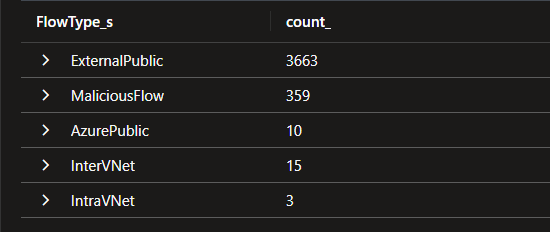
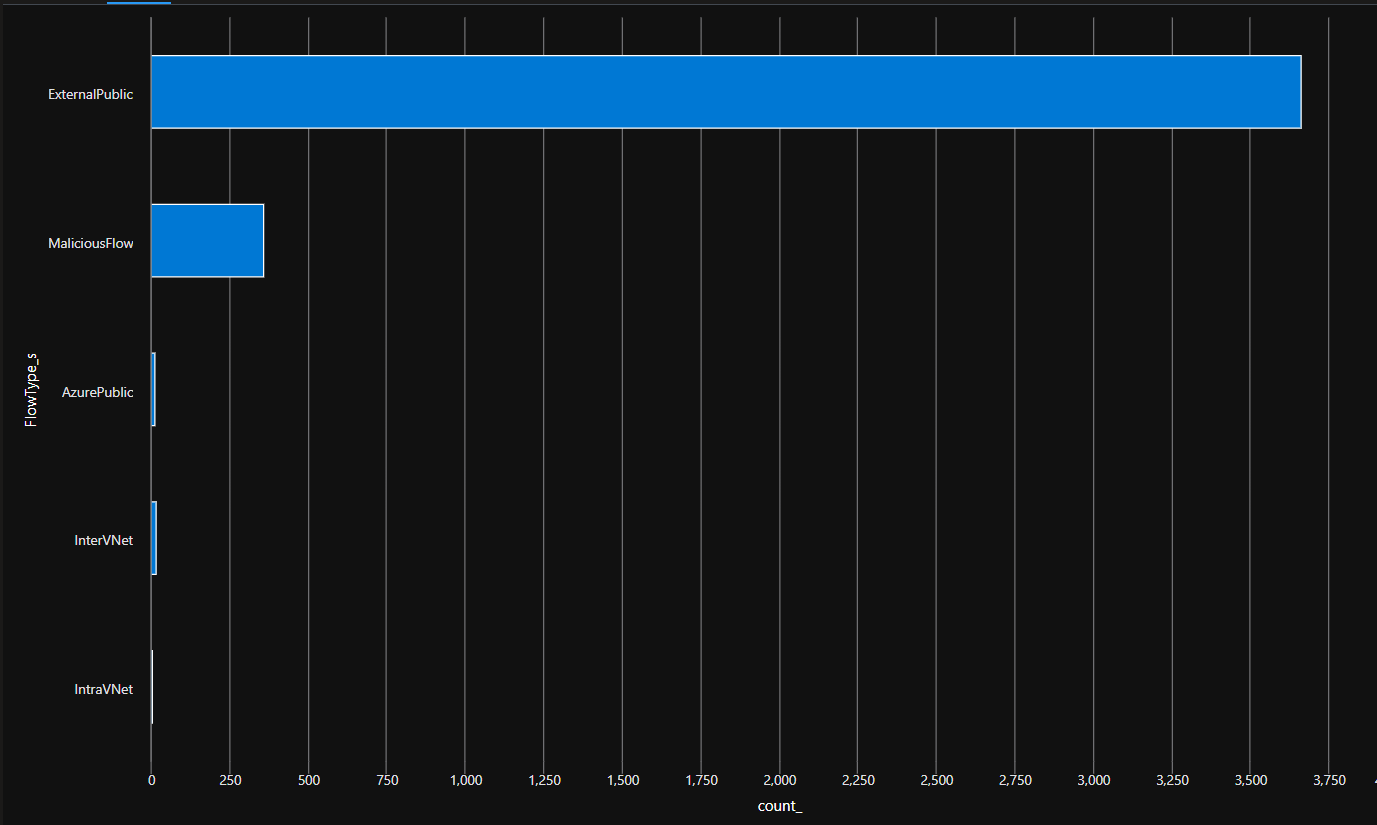
Also, since those are the underlying logs for Traffic Analytics, we can get a classification of the flows with FlowType_s
AzureNetworkAnalytics_CL
| where SubType_s == 'FlowLog'
| where TimeGenerated >= ago(7d)
| where NSGList_s == '16e85b36-5c9d-48cc-a45d-c672a4393c36/rg-spoke-lab-001/nsg-sub1-vnet-sbx-spokedemo11'
| summarize count() by FlowType_s
| render barchart
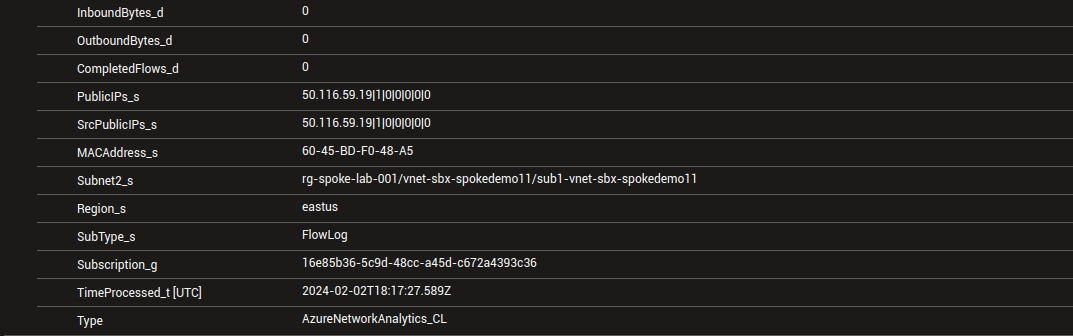
Last but not least, there are arguments to identify source and destination IPs, regardless of the rules involved. This was our main limitation with diagnostic settings logs, it’s now much more complete.
DestIP_sSrcIP_sSrcPublicIPs_sPublicIPs_s
There is one trick though, all IP related arguments are not necessarily filled, depending on the flow type. So we still need to search a little bit to get the information that we want.
The query below can be used to get a summary of the flow logs:
AzureNetworkAnalytics_CL
| where SubType_s == 'FlowLog'
| project DestIP_s, SrcIP_s, SrcPublicIPs_s, NIC_s, VM_s, Subnet_s,DestPort_d, L4Protocol_s, L7Protocol_s, FlowStatus_s, FlowDirection_s,FlowType_s,NSGList_s, NSGRules_s, NSGRuleType_s, FlowStartTime_t, FlowEndTime_t
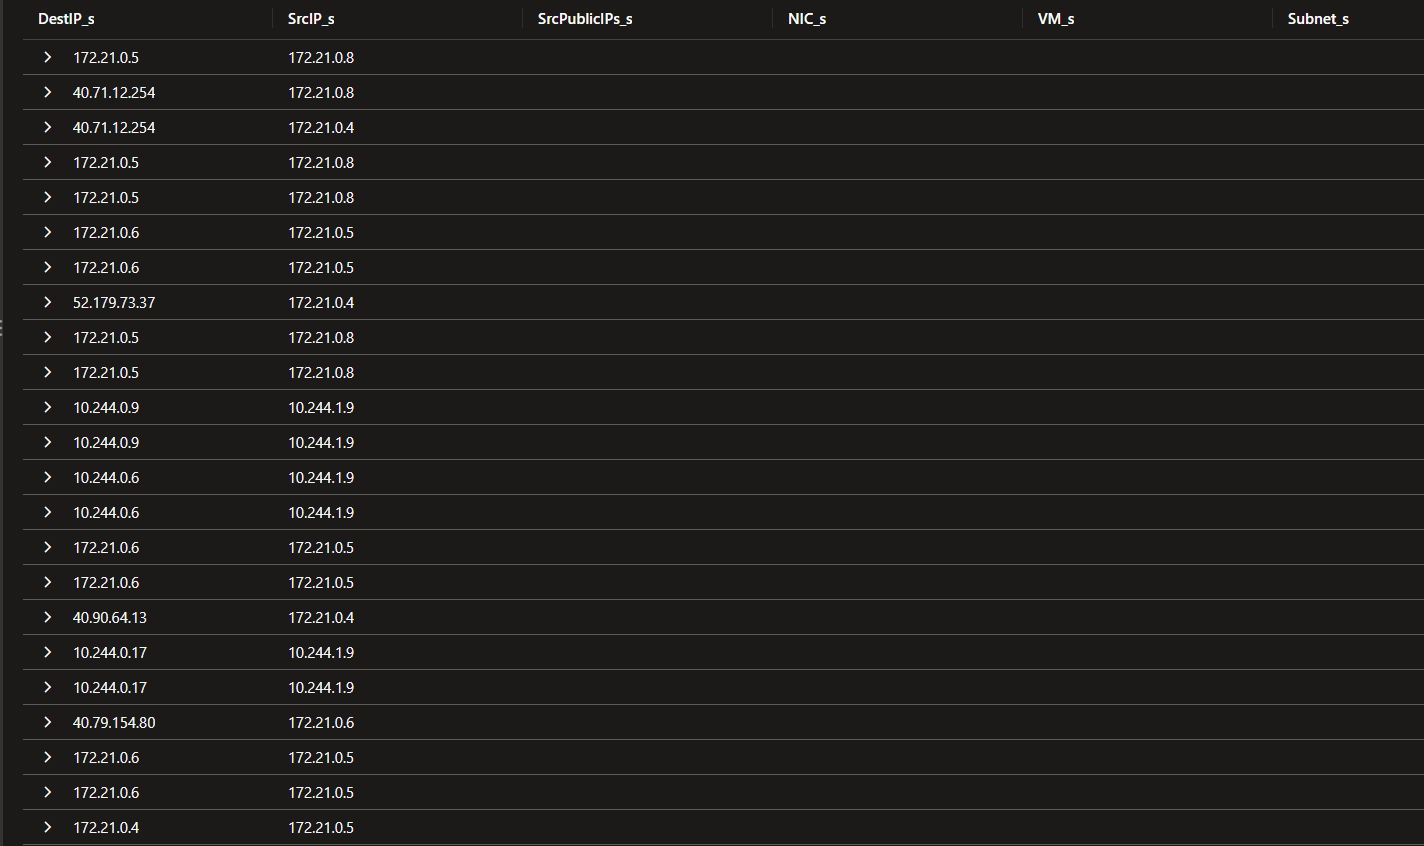
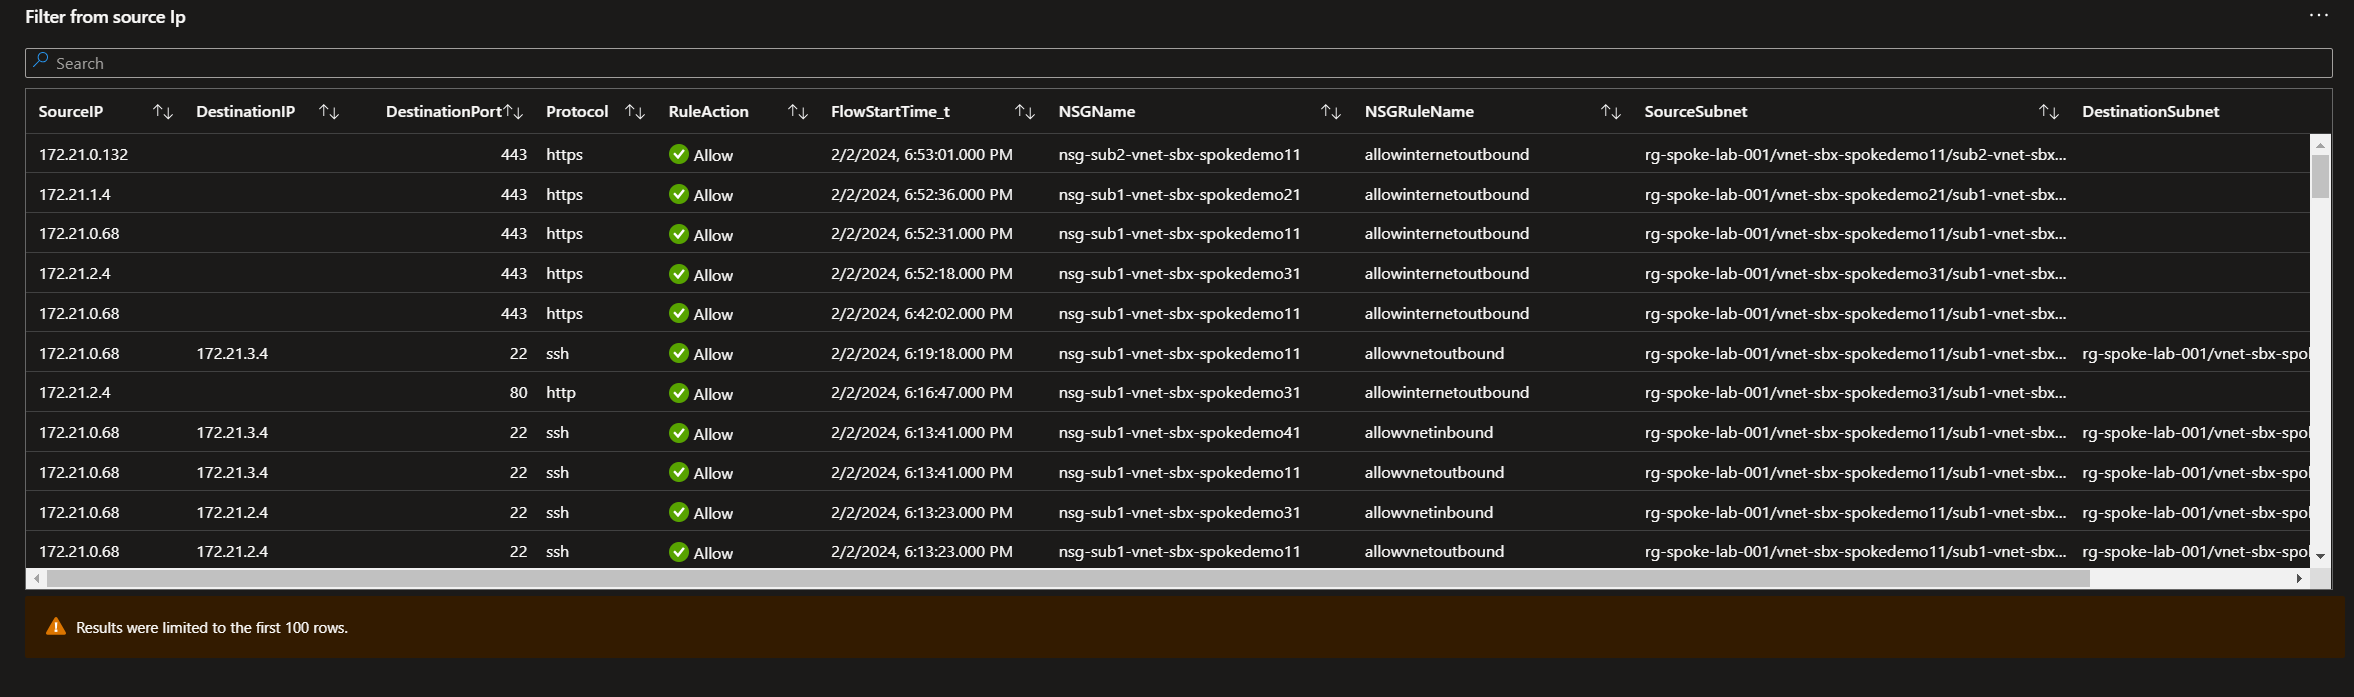
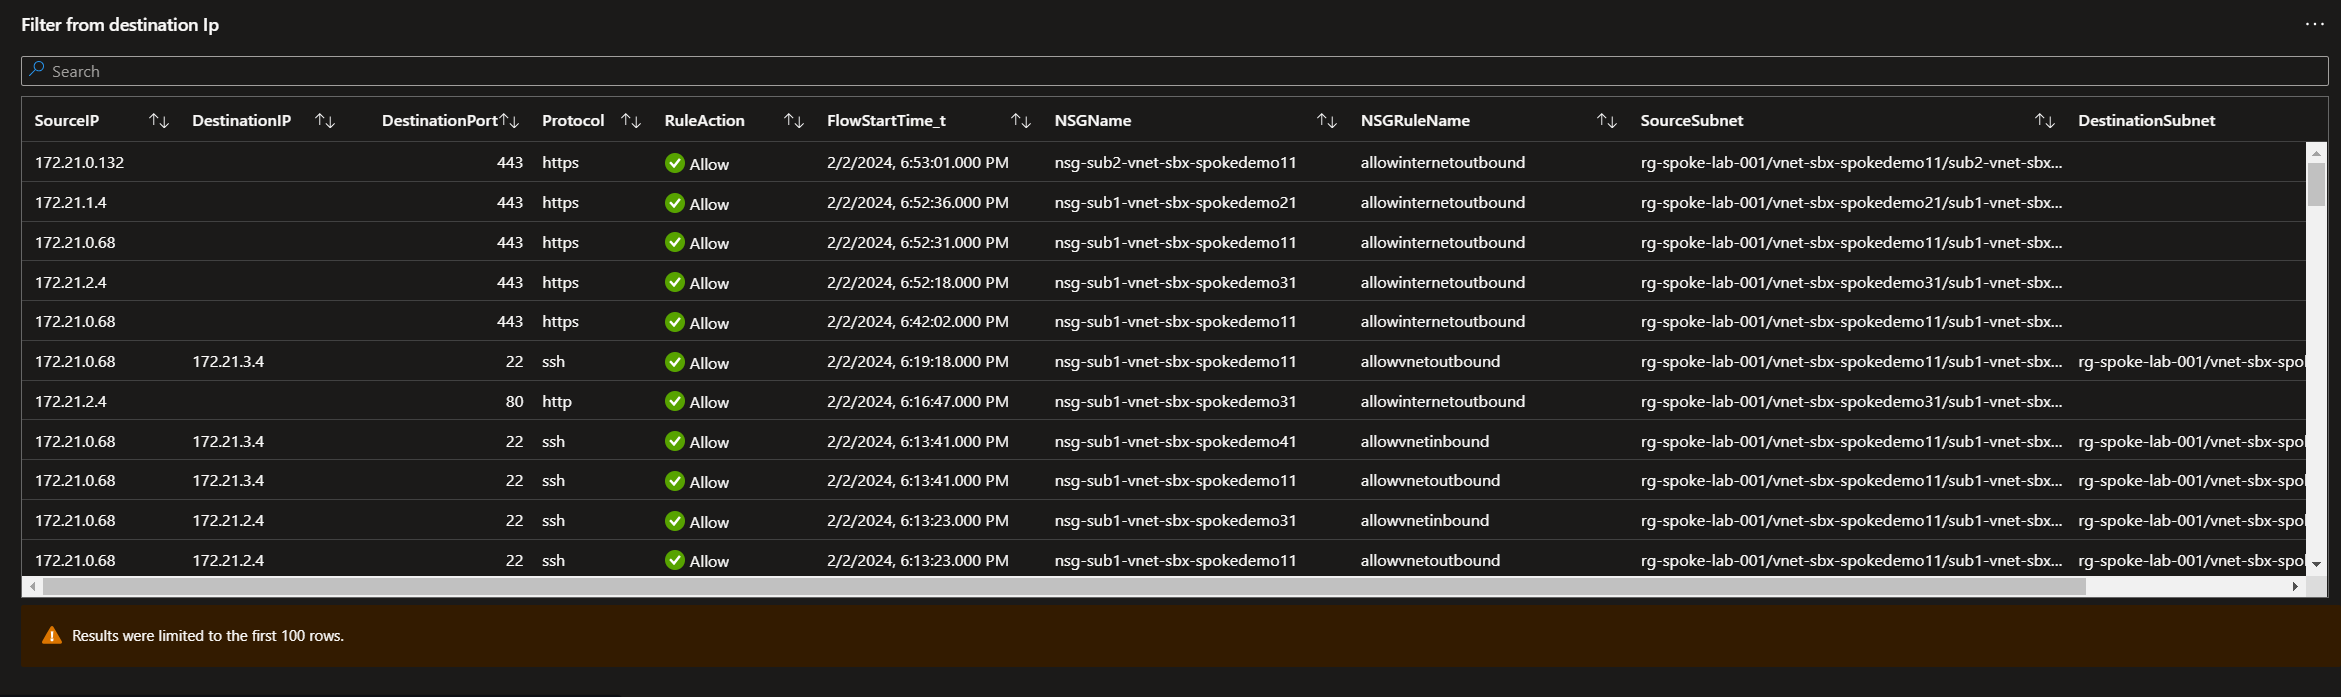
Identifying all flows on a specific IP would gives us something like this.
AzureNetworkAnalytics_CL
| where SubType_s == 'FlowLog'
| where TimeGenerated >= ago(7d)
| where FlowDirection_s == 'I'
| where DestIP_s == '172.21.0.68'
We could also leverage the VM_s argument to identify more clearly a target virtual machine, or the NIC_s to identify a Network Interface Card
AzureNetworkAnalytics_CL
| where SubType_s == 'FlowLog'
| where TimeGenerated >= ago(7d)
| where FlowDirection_s == 'I'
| where VM_s contains 'spoke11-vm1'
Getting a view of SSH connection all over our tenant (with logged configured), we can use the query below.
AzureNetworkAnalytics_CL
| where SubType_s == 'FlowLog'
| where TimeGenerated >= ago(7d)
| where L7Protocol_s contains 'ssh'
| summarize count() by DestIP_s, FlowStatus_s, SrcPublicIPs_s, SrcIP_s, FlowType_s
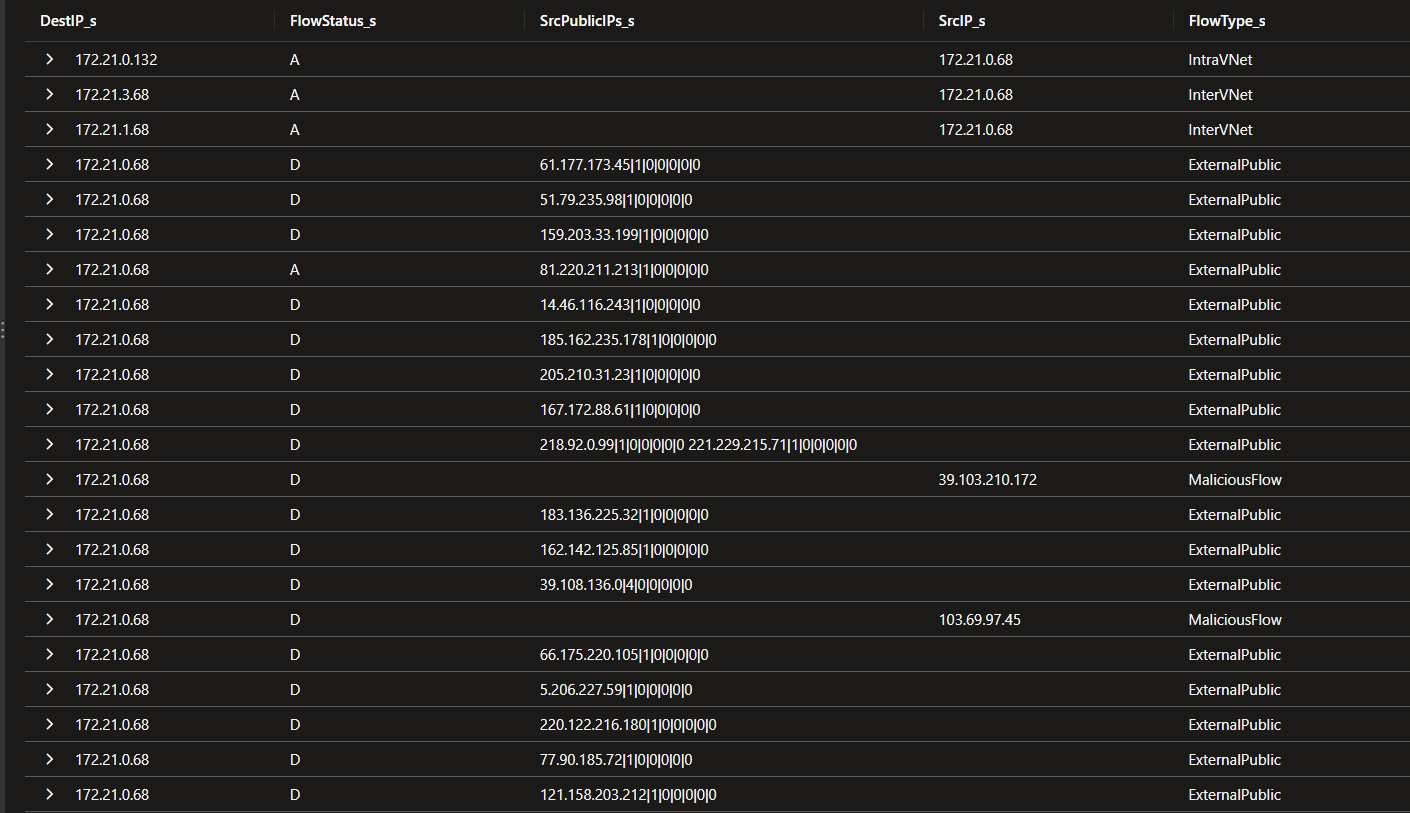
Some things to remember:
For ExternalPublic traffic, the SrcIP_s is not filled. We need to rely on either PublicIPs_s or SrcPublicIPs_s.
For MaliciousFlow, this time the SrcIP_s is filled. An interesting query for this kind of flow would be to couple it with the FlowStatus_s equals to A to verify that no Malicu=ious flows are allowed.
AzureNetworkAnalytics_CL
| where SubType_s == 'FlowLog'
| where TimeGenerated >= ago(7d)
| where FlowDirection_s == 'I'
| where VM_s contains 'spoke11-vm1'
| where FlowType_s == 'MaliciousFlow' and FlowStatus_s == 'D'
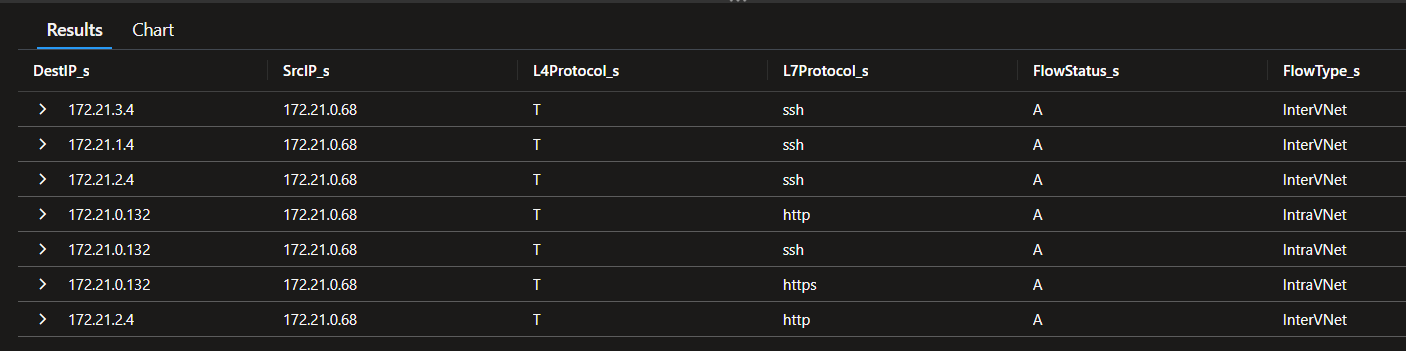
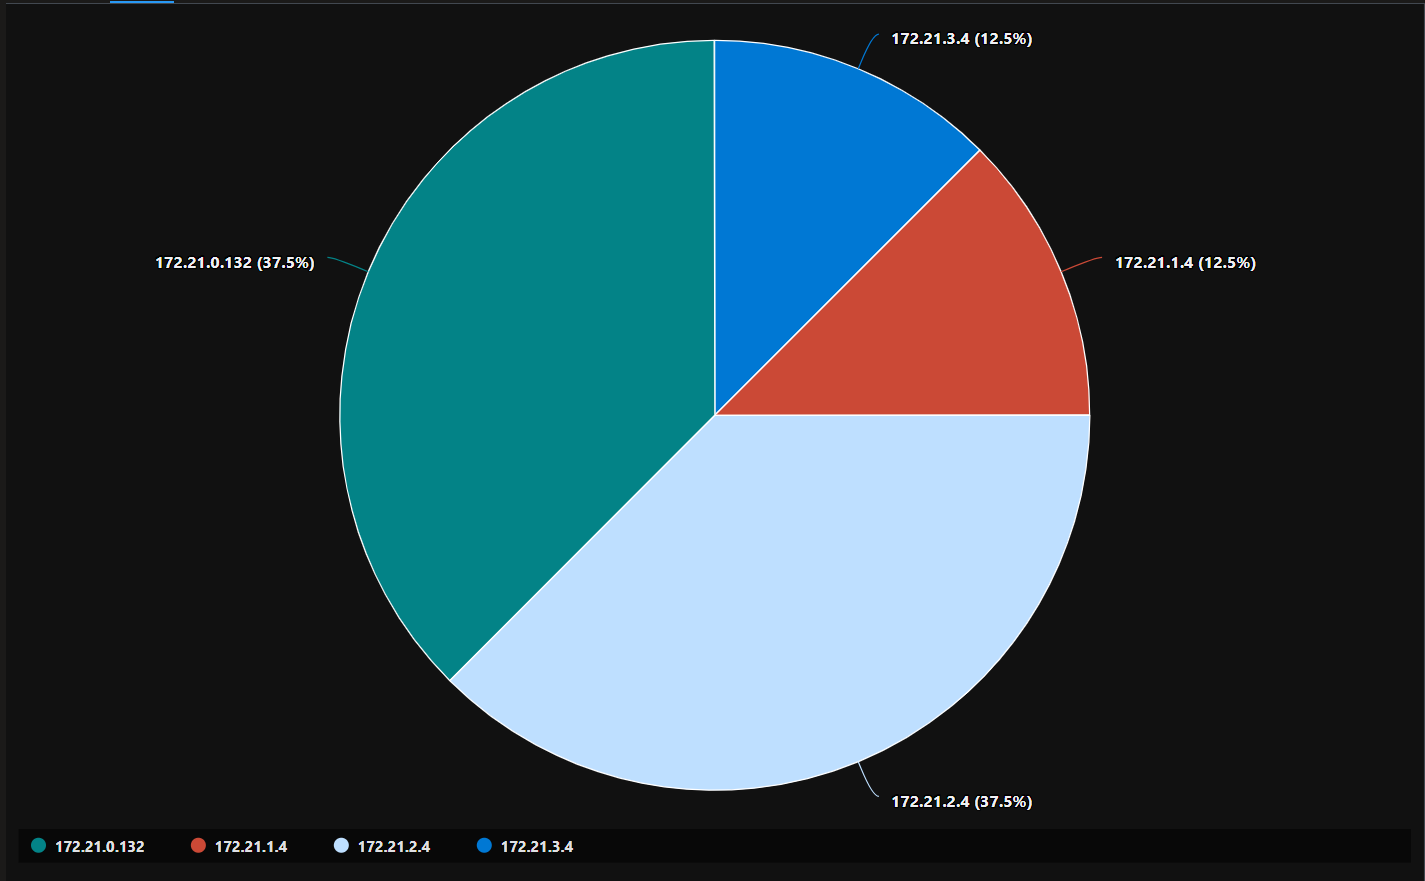
For the record, we can target specific flows suh as IntraVnet for flows inside the Vnet, and InterVnet for flows going through different VNets, in this sample, through a Virtual WAN
AzureNetworkAnalytics_CL
| where SubType_s == 'FlowLog'
| where TimeGenerated >= ago(7d)
| where FlowDirection_s == 'I'
| where FlowType_s contains 'VNet'
| summarize count() by DestIP_s, SrcIP_s, L4Protocol_s, L7Protocol_s, FlowStatus_s, FlowType_s
| render piechart
Ok, now we know how to get real network information. But not everyone is able to access a log analytics workspace, or have the knowledge to query the logs. So what can we do? What about some dashboards? Let’s see this.
3. What about some dashboard?
3.1. Azure dashboard
In Azure, everything related to observability is related to Azure Monitor. We have 2 native ways to have visual informations on Azur emonitor things, in our case Network logs. The first one is, well the Azure dashboard, that we get when we click on the Dashboard button in the portal
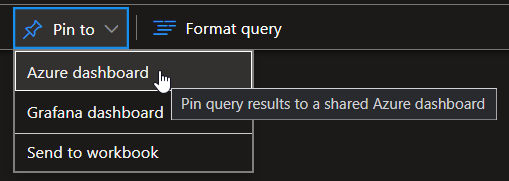
Creating a dashboard from the logs in a log analytics workspace is quite easy. We just need to use the Pin To button to send the log query and its reult to a specific dashboard.
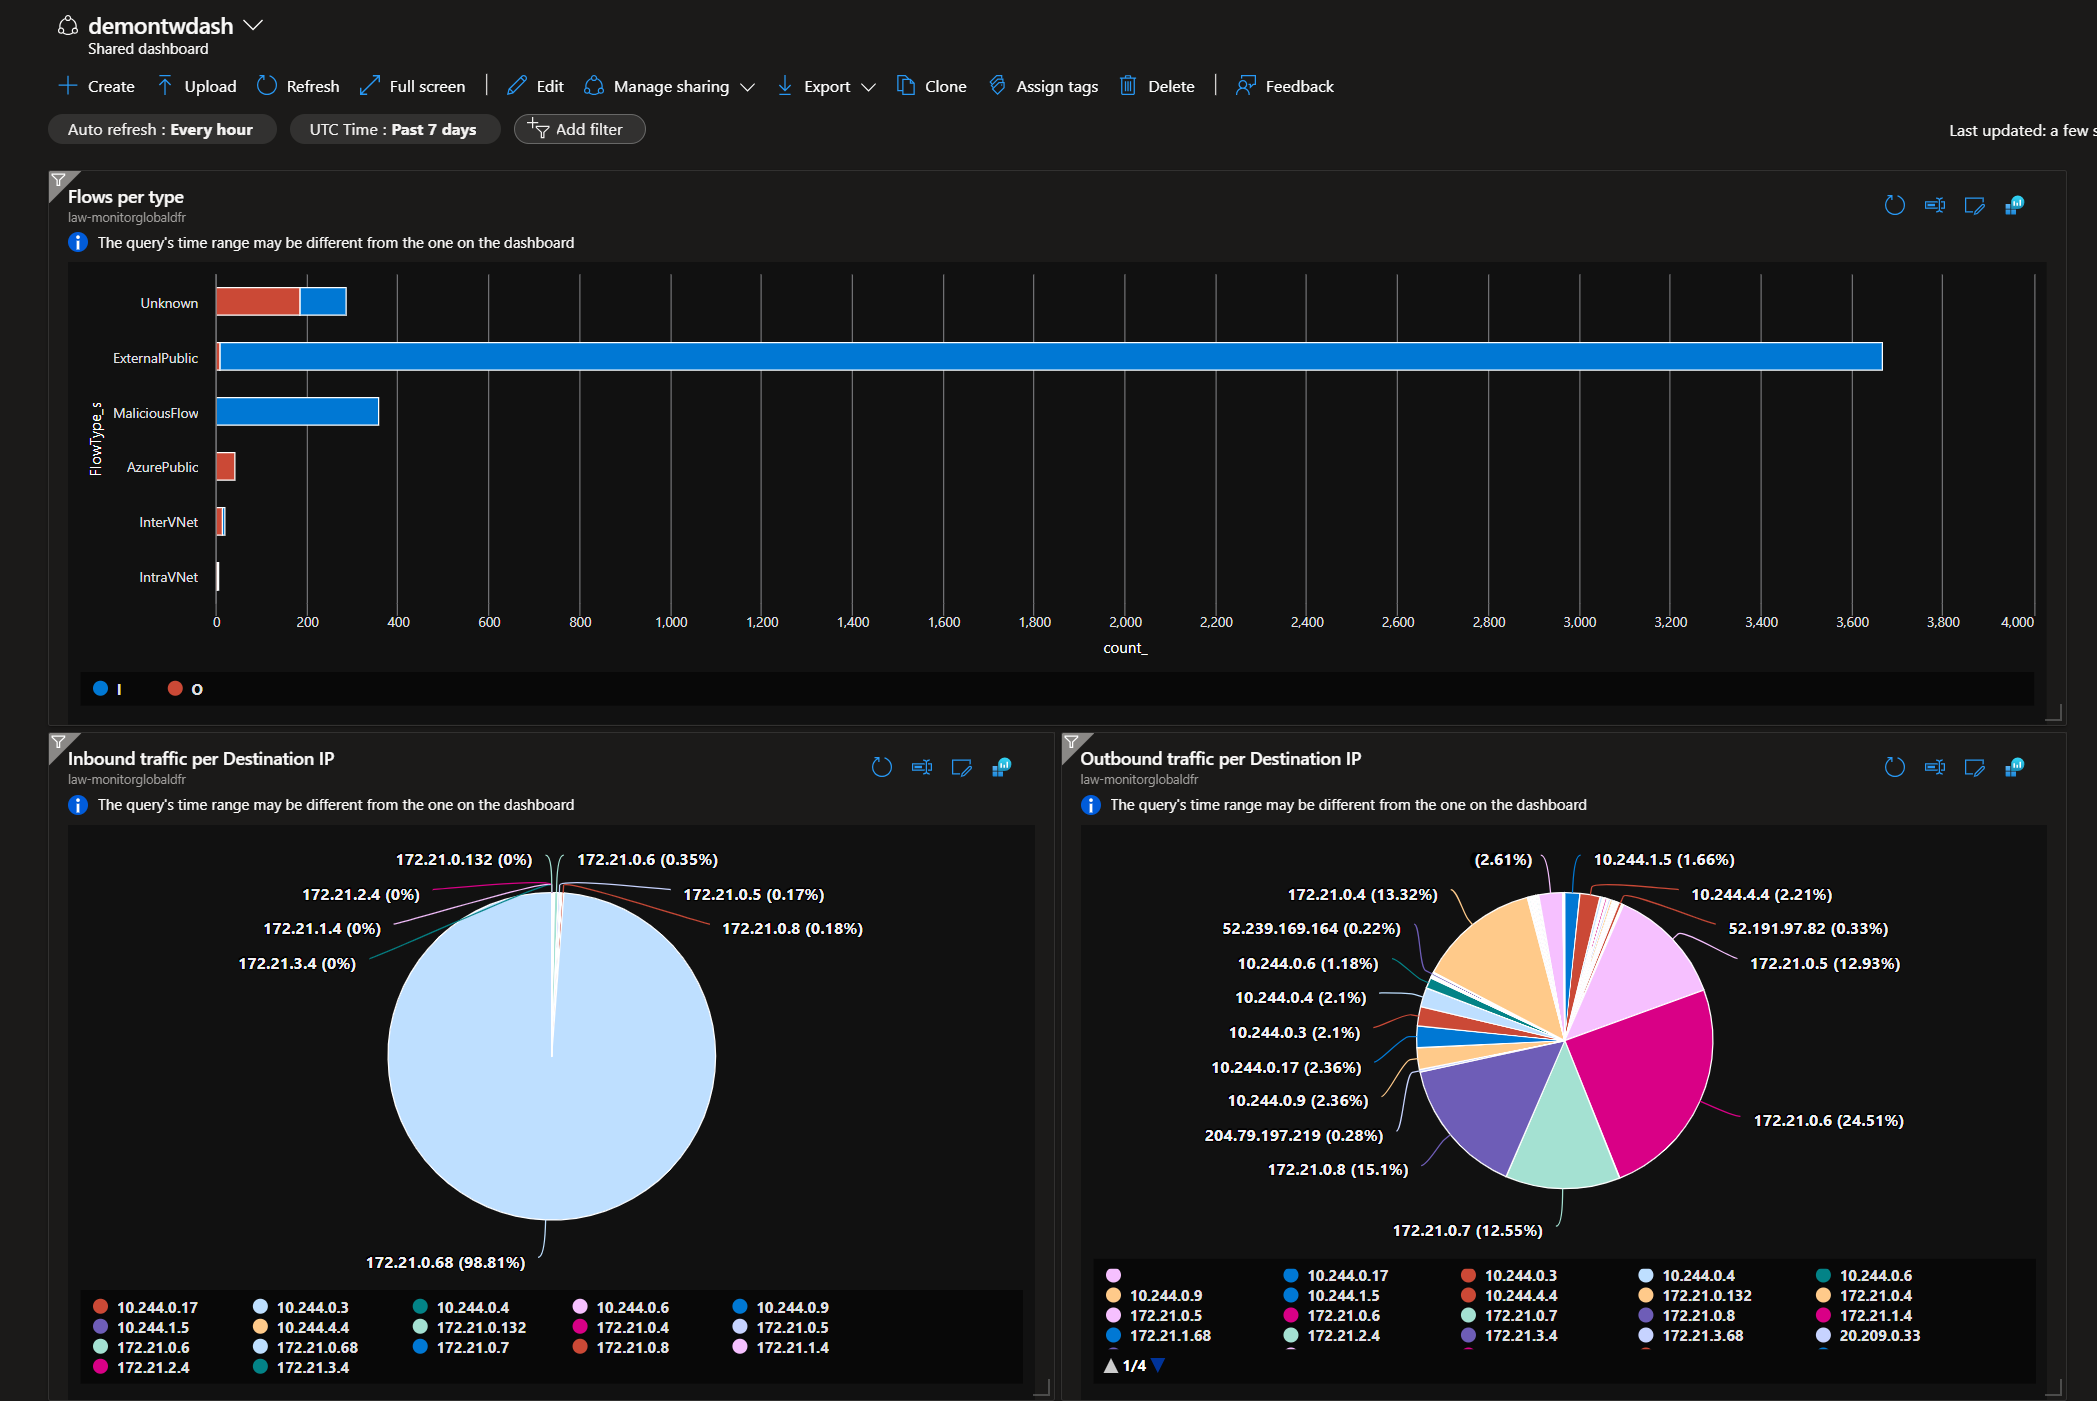
Let’s say that we want to have:
- A Chart showing the differents flows per type
AzureNetworkAnalytics_CL
| where SubType_s == 'FlowLog'
| where TimeGenerated >= ago(7d)
| summarize count() by FlowType_s, FlowDirection_s, FlowStartTime_s, FlowStatus_s
| render barchart
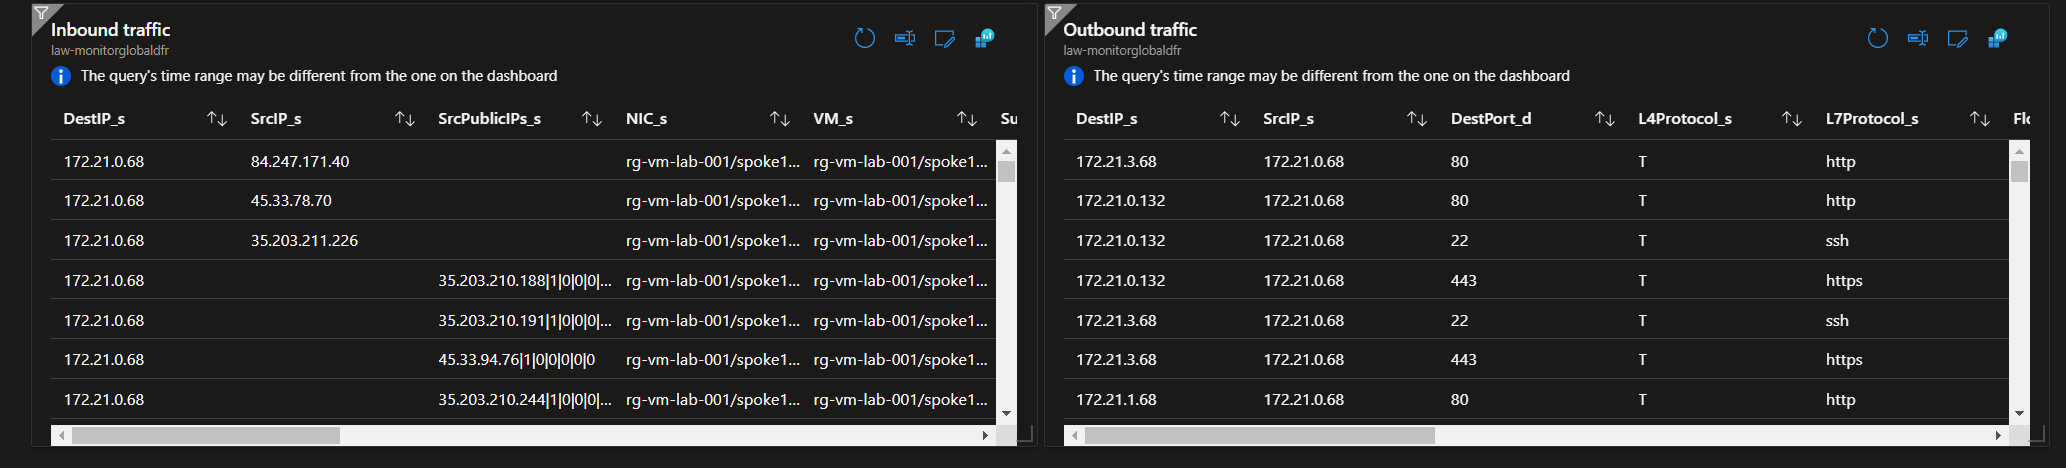
- A query of Inbound flows
AzureNetworkAnalytics_CL
| where SubType_s == 'FlowLog'
| where TimeGenerated >= ago(7d)
| where FlowDirection_s == 'I'
| project DestIP_s, SrcIP_s, SrcPublicIPs_s, NIC_s, VM_s, Subnet_s,DestPort_d, L4Protocol_s, L7Protocol_s, FlowStatus_s, FlowDirection_s,FlowType_s,NSGList_s, NSGRules_s, NSGRuleType_s, FlowStartTime_t, FlowEndTime_t
- A query of Outbound flows
AzureNetworkAnalytics_CL
| where SubType_s == 'FlowLog'
| where TimeGenerated >= ago(7d)
| where FlowDirection_s == 'O'
| project DestIP_s, SrcIP_s, DestPort_d, L4Protocol_s, L7Protocol_s, FlowStatus_s, FlowDirection_s,FlowType_s,NSGList_s, NSGRules_s, NSGRuleType_s, FlowStartTime_t, FlowEndTime_t
And we’ll also add a nice chart for both inbound and outbound flows
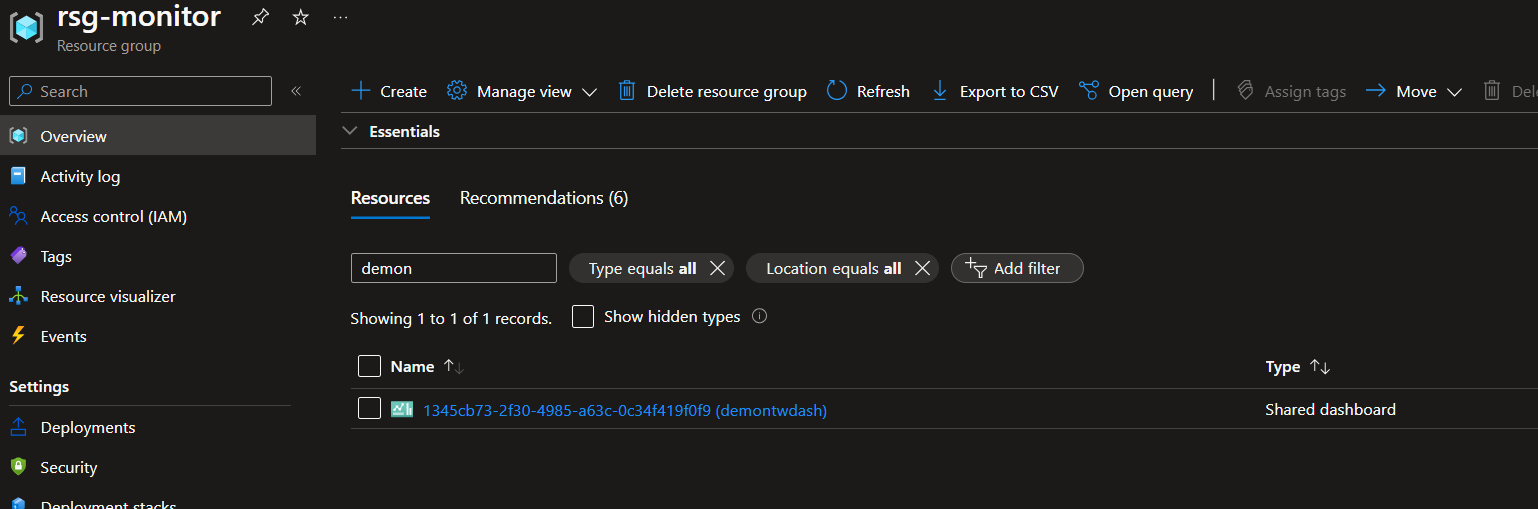
Once we are finished, the dashboard is available as a resource as a resource and we can get a view of what we selected without recreating the query all the time.
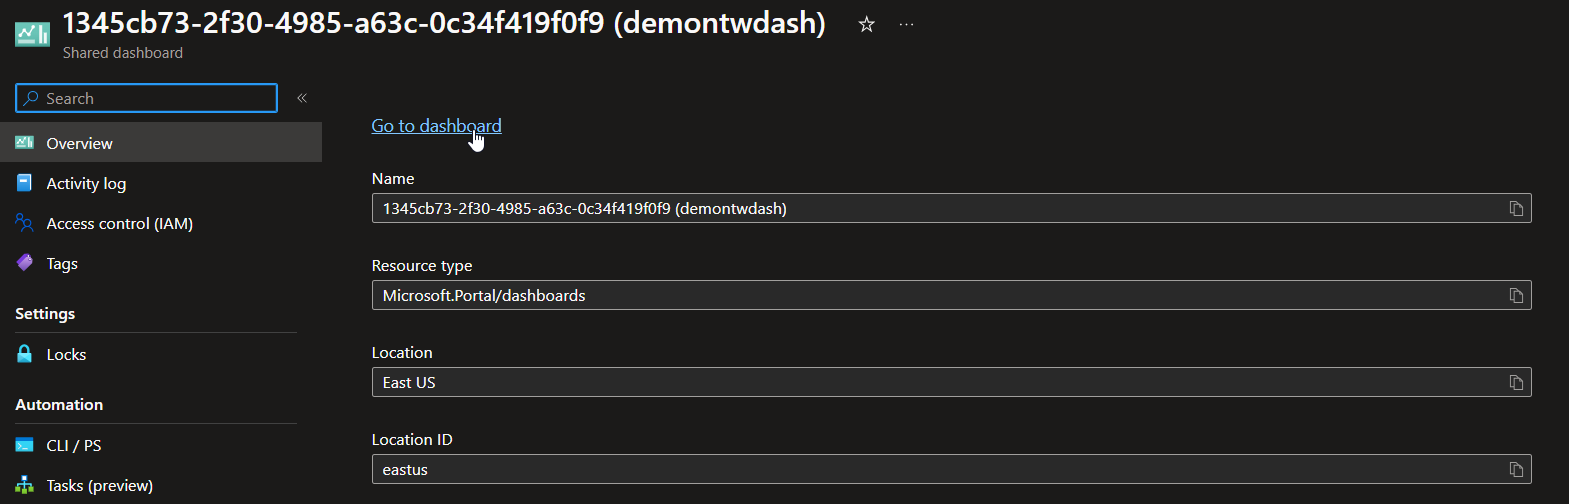
We can also download the dashboard in json format
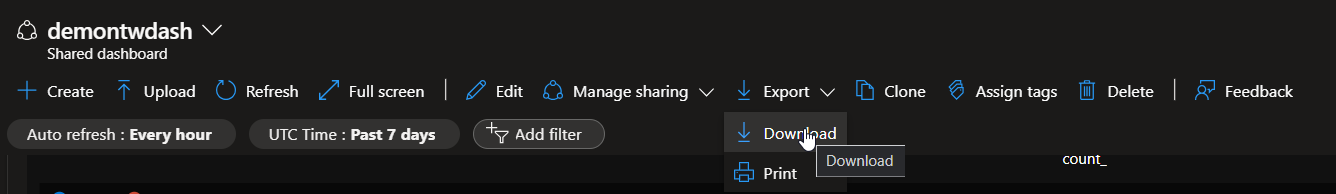
This gives us a json similar to this :
{
  "properties": {
    "lenses": {},
    "metadata": {
      "model": {
        "filterLocale": {
          "value": "en-us"
        },
        "filters": {
          "value": {},
        "timeRange": {
          "value": {
            "relative": {
              "duration": 24,
              "timeUnit": 1
            }
          },
          "type": "MsPortalFx.Composition.Configuration.ValueTypes.TimeRange"
        }
      }
    }
  },
  "name": "Dashboard-Flowlogs",
  "type": "Microsoft.Portal/dashboards",
  "location": "INSERT LOCATION",
  "tags": {
    "hidden-title": "Dashboard-Flowlogs"
  },
  "apiVersion": "2015-08-01-preview"
}
Keeping only the part between the properties {}, we can leverage a small terraform configuration to recreate the dashboard anywhere.
resource "azurerm_portal_dashboard" "DemoNSG" {
  dashboard_properties = templatefile("./template/demontwdash.json",
    {
      LawId = azurerm_log_analytics_workspace.LawMonitor.id
      LawName = azurerm_log_analytics_workspace.LawMonitor.name
    }
  )
  location             = azurerm_resource_group.RG["rsg-monitor"].location
  name                 = uuid()
  resource_group_name  = azurerm_resource_group.RG["rsg-monitor"].name
  tags = {
    hidden-title = "Dashboard-Flowlogs"
  }

  lifecycle {
    ignore_changes = [ name ]
  }
}
Note the use of the templatefile() function which we use to replace the occurence of the Log Analytics workspace resource Id, and its name in the template.
  "value": {
    "resourceIds": [
      "${LawId}"
    ]
  },
{
  "name": "PartSubTitle",
  "value": "${LawName}",
  "isOptional": true
},
And that’s how we get a dashboard. But there are also workbook on Azure monitor now.
3.2. Azure workbook
Azure Monitor workbooks are a more modern way to create visual report on the portal, as explained in the Azure documentation.
I won’t pretend to be an expert on Workbook creation, but I did found a noce Workbook for NSG somewhere on the Internet (and when I say somewhere, that means I totally forgot where, so If you’re the author, please notify me so I can give you credits)
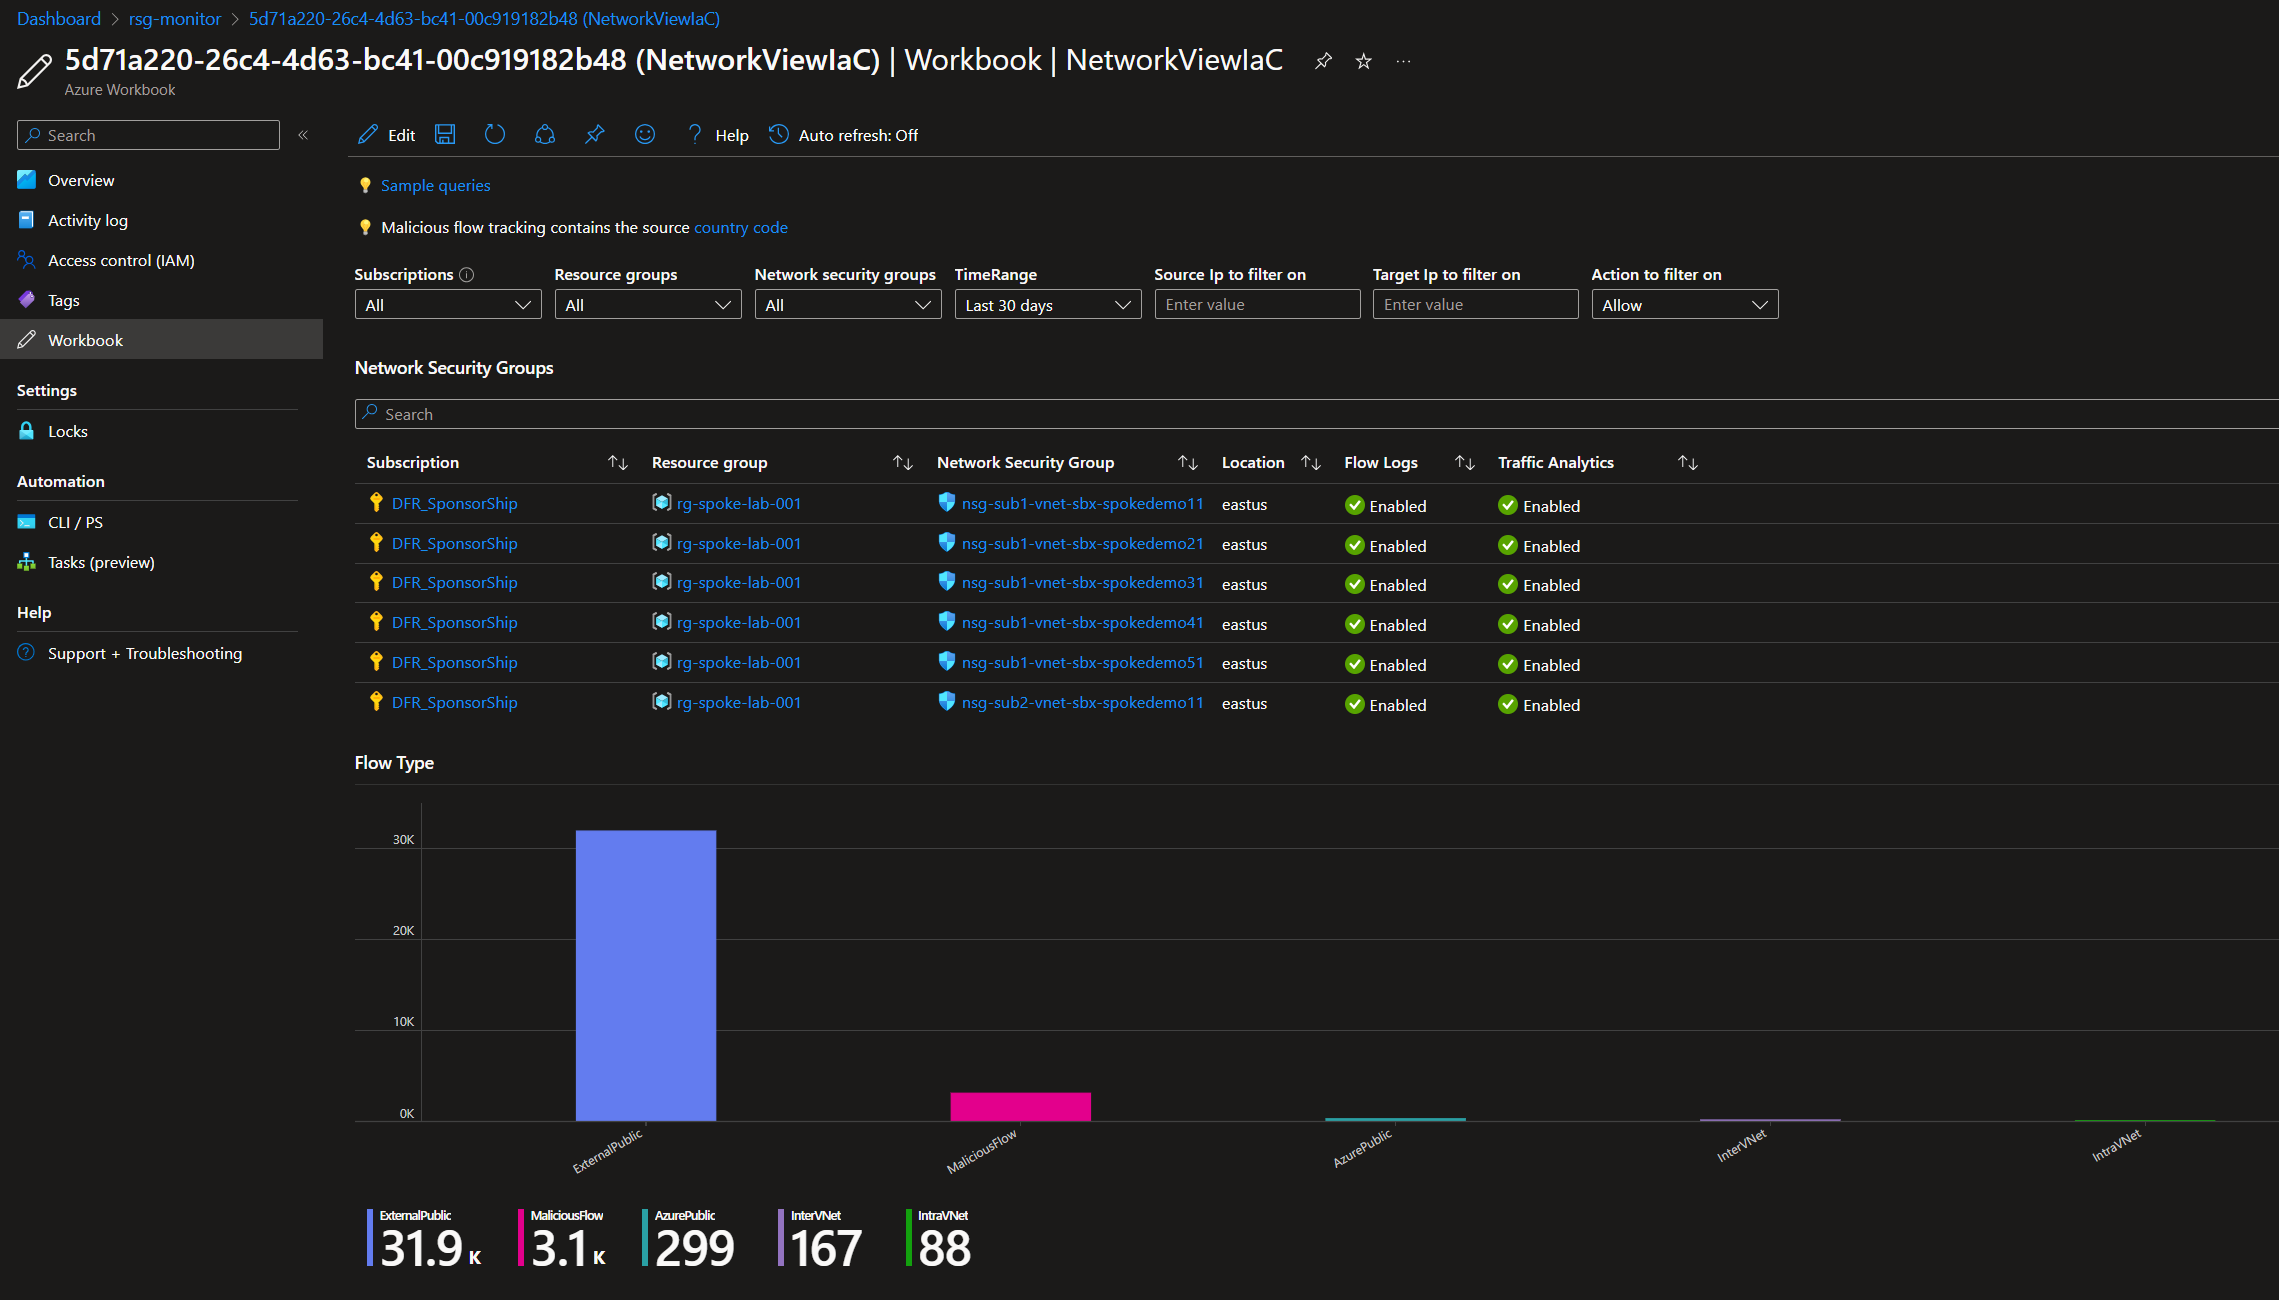
Once you get the proper definition file for your workbook, you can create from the portal or with a bit of terraform code
resource "azurerm_application_insights_workbook" "NtwMonitoringWorkbook3" {
  category             = "workbook"
  data_json            = file("./template/templatewrkbook.json")
  description          = null
  display_name         = "NetworkViewIaC"
  location             = azurerm_resource_group.RG["rsg-monitor"].location
  name                 = uuid()
  resource_group_name  = azurerm_resource_group.RG["rsg-monitor"].name
  source_id            = "azure monitor"
  storage_container_id = null
  tags                 = {}

  lifecycle {
    ignore_changes = [ name ]
  }
}
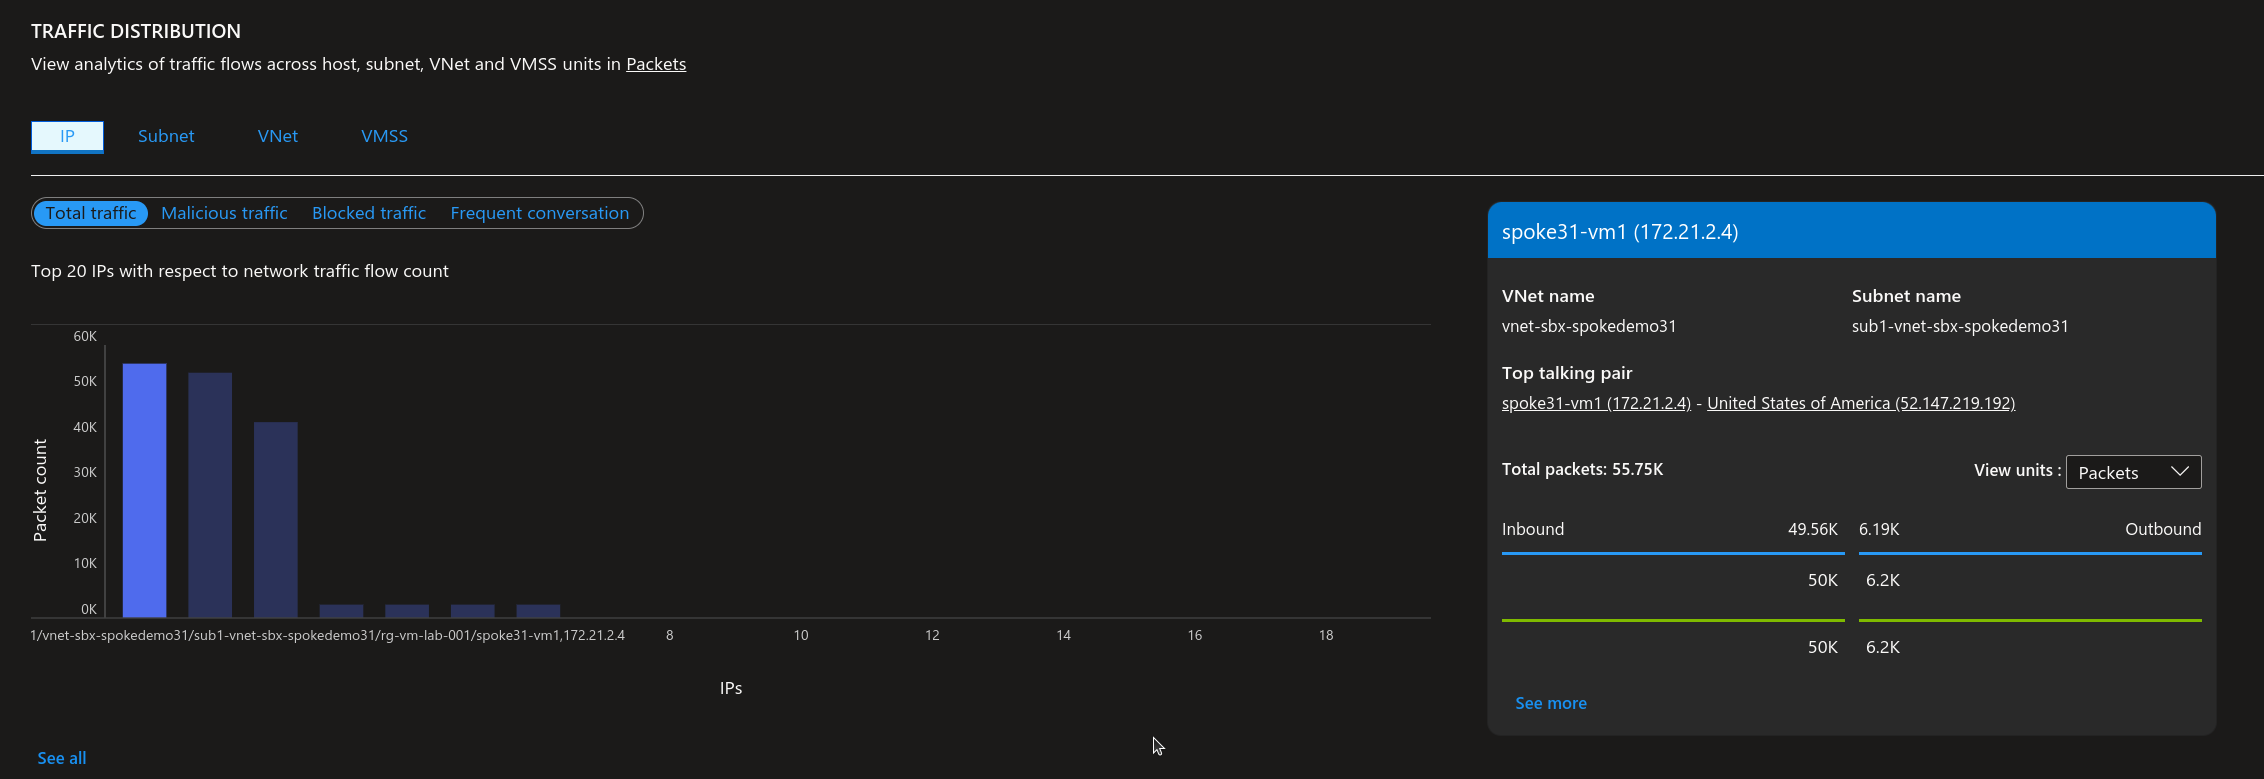
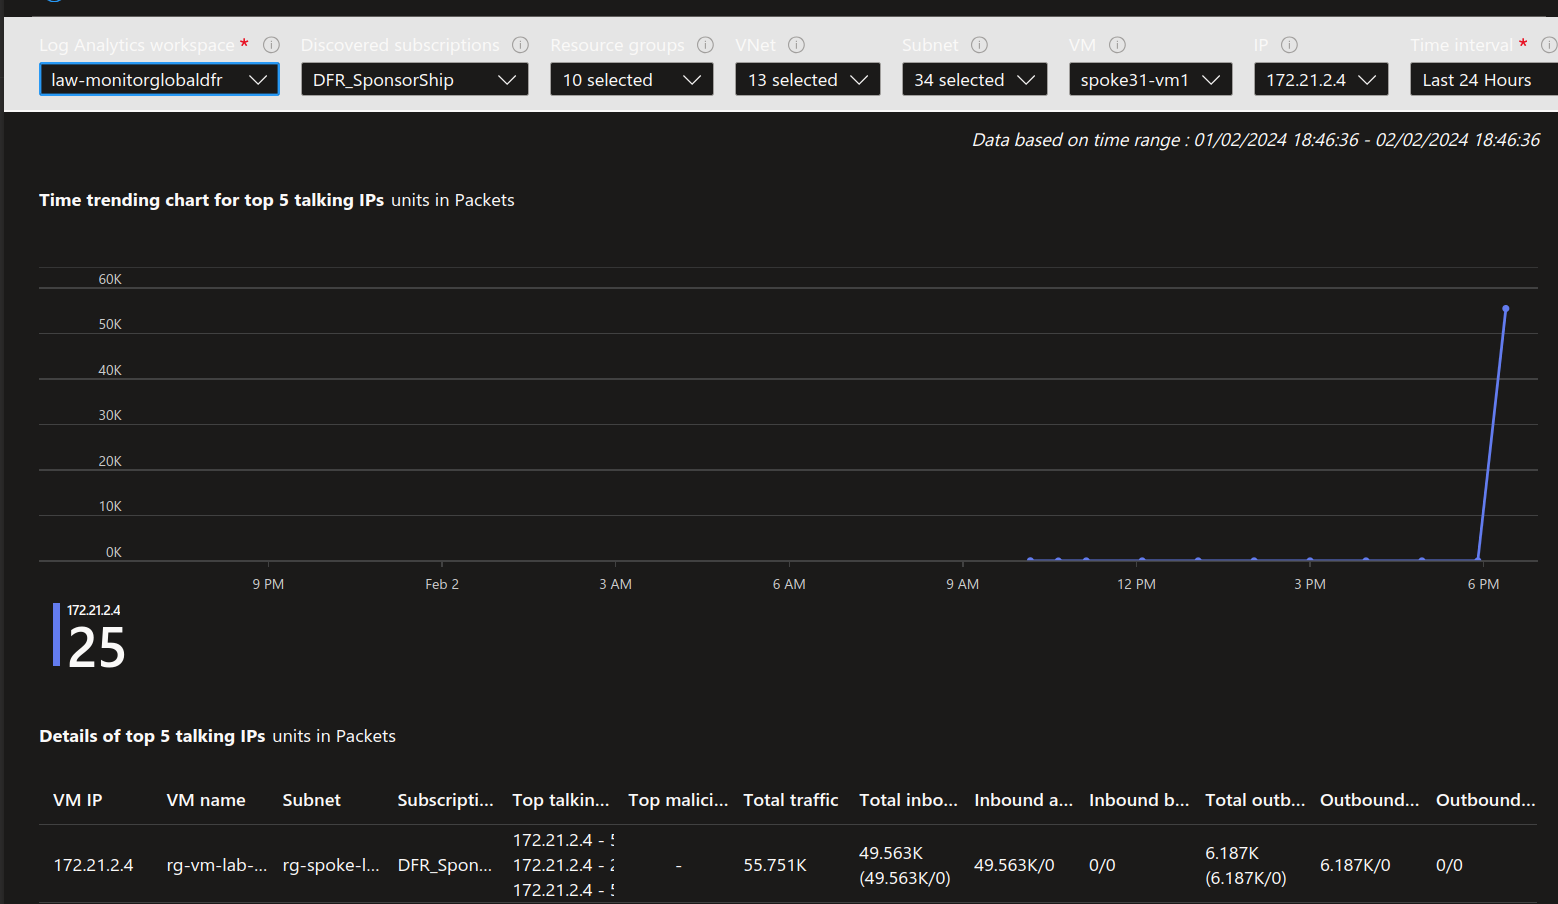
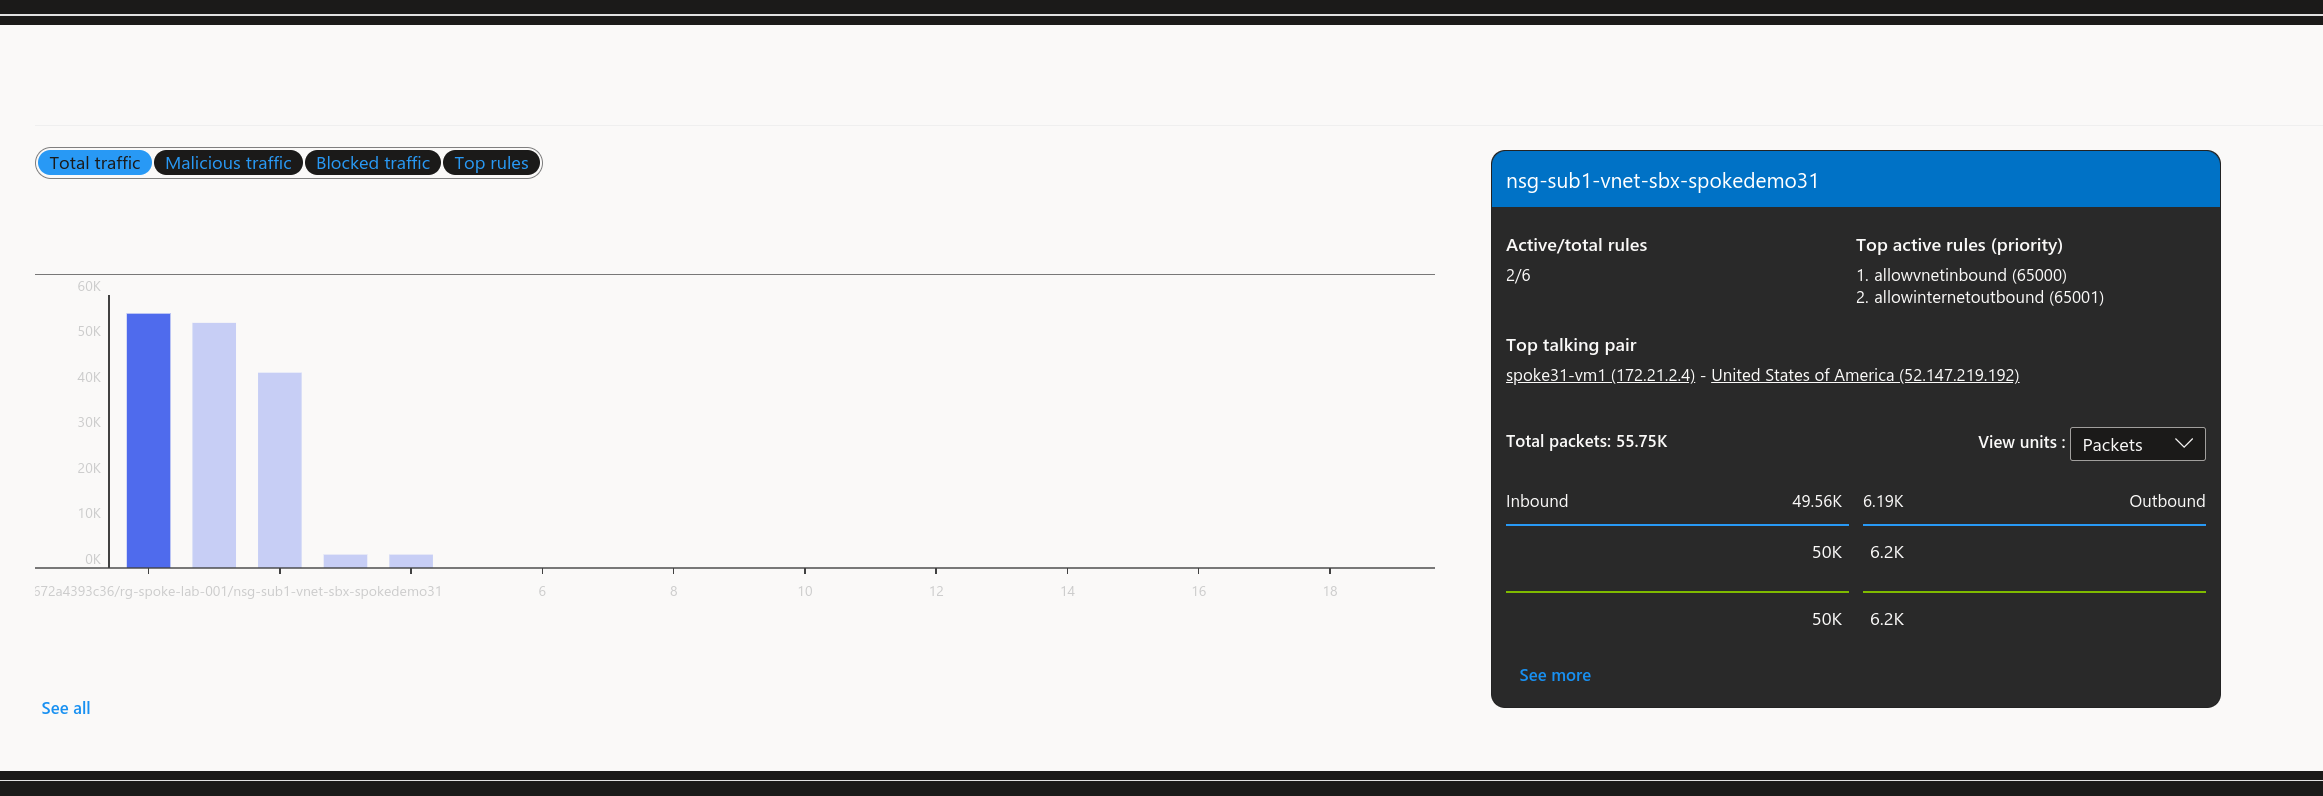
And you can get something like that:
Ok time to wrap this up!
4. Wrapping it up
So now we do have an idea on how to get information on our flows.
The first thing to know is that everything is about logs. In this case, Flow logs, rather thatn diagnostic settings logs, even if we can get a bunch of nice informations with those.
Second, we need to know and have access to a log analytics workspace (or another log sink on which the flow logs are sent, in thise case, we have to find another way of querying the logs and everything I showed is false ^^).
Graphical reports and dashboards can be generated with Azure Monitor dashboards and Workbooks. Generating those dashboards/workbooks can however be cumbersome. Hopefully, there are some resources on the community to help us getting started.
Now, since part 1 of the article, I mentionned also Azure Firewall, but it was already too much for this one so I’ll talk about that antoehr time.
I hope it helped. See you soon!